Who is being hurt the most?
Three different think tanks produced three contrasting analyses of the effects of the Chancellor’s autumn statement of November 17th 2022 and its accompanying Office of Budget Responsibility (OBR) report. Everyone agreed that we were almost all about to get poorer, but it was not clear who would suffer the most.
The first, analysis by the Institute for Fiscal Studies (IFS), said that ‘The most striking figures in the OBR report are those pertaining to living standards, as measured by Real Household Disposable Income per person. Down 7% over this year and next, much the biggest fall in living memory and off the back of very poor income growth for many years. This will hit everyone. But perhaps it will be those on middling sorts of incomes who feel the biggest hit. They won’t benefit from the targeted support to those on means-tested benefits. Their wages are falling and their taxes are rising. Middle England is set for a shock.’
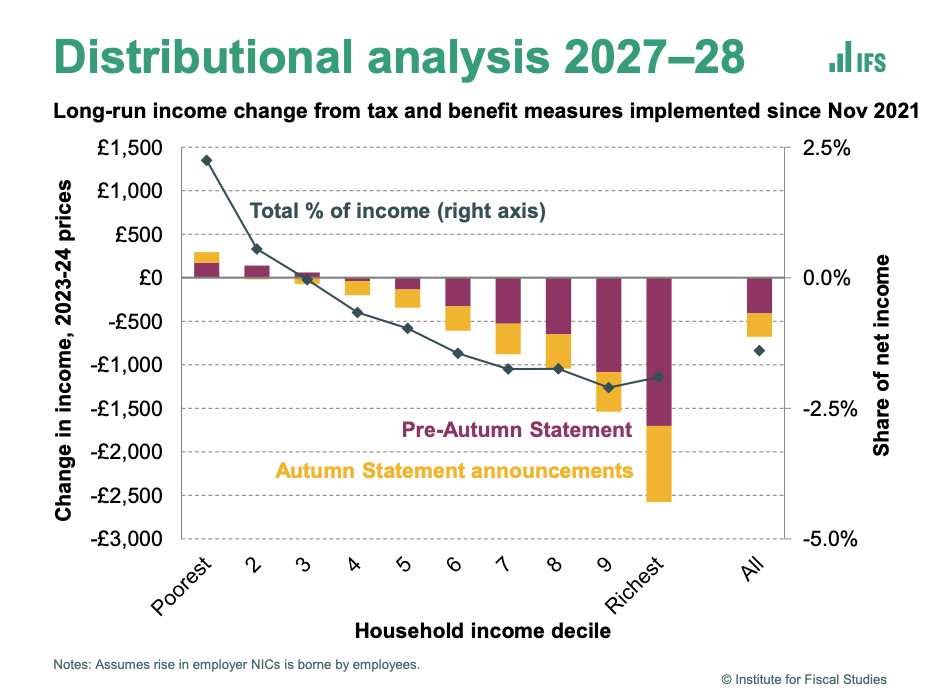
The distribution effects of the November 2022 autumn statement – IFS
Source Institute for Fiscal Studies
The IFS produced the claret and amber graph shown here, showing the longer term implications of the autumn statement on households. The chart is of the ten conventional income groups. The implication being that the worse-off would benefit most. This was due to the state pension and many welfare benefits being up-rated by inflation. The IFS graph implied that the richest would lose the most due to tax rises. Their summary, that middle England was set to be hardest hit, suggested that the richest could quite easily absorb this dip. It was a dip their graph showed to be actually slightly smaller in terms of share of income of the best-off tenth, as compared to the loss for next best-off tenth. The IFS highlighted how a particular focus on targeting some more energy-cost-related benefit payments to the very poorest (to help with the rising costs of fuel) had caused the incomes of the poorest tenth to rise higher than pre-statement changes had promised.
Of course, the IFS graph was just showing changes in income, not in income after taking into account the rising cost of living – which is why the poorest appeared as if they were doing better than before, whereas in fact they were about to become much poorer. The second graph shown here, drawn by The Resolution Foundation (RF), illustrates this. The RF produced the most complicated and colourful chart, their “Figure 31” emphasised how the removal of the Health and Social Care Levy had given most money to those in the very top 5% of the income distribution. The levy had been announced in the run up to Christmas 2021, and was removed by the short-lived chancellor Kwasi Kwarteng with effect from 6 November 2022. It was one of the few things Kwarteng did, along with lifting the cap on bankers bonuses, that Jeremy Hunt, his successor, did not reverse. The very best-off benefited the most overall, although the title of “Figure 31” does not make that very clear, and as a percentage of their income, the gain for the top 5% is lowest, because their incomes are so very high.
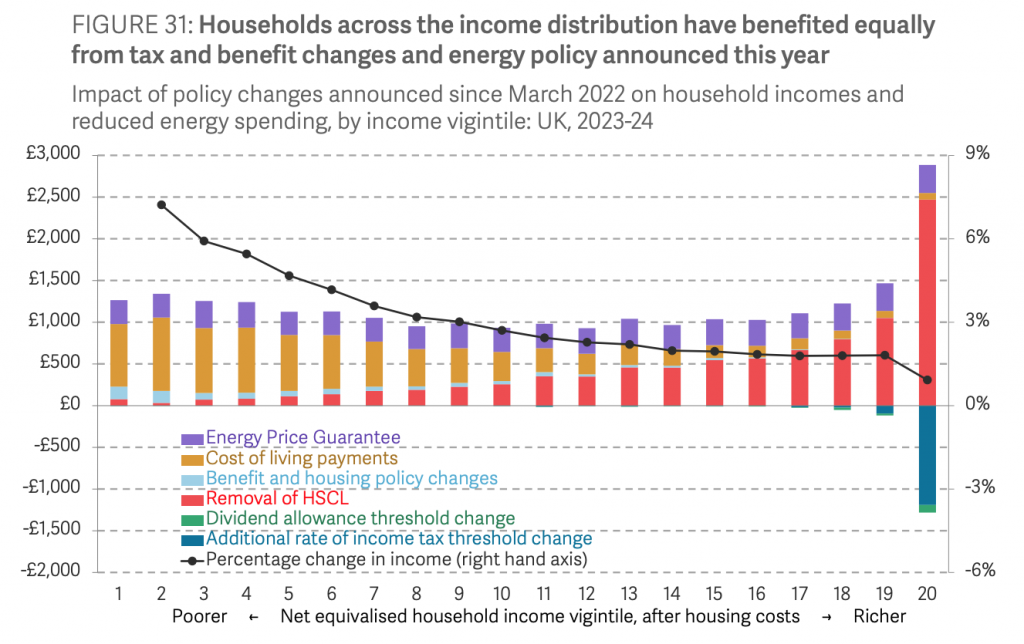
The distribution effects of the November 2022 autumn statement – Resolution Foundation
Source: The Resolution Foundation
A third think tank, The New Economics Foundation (NEF), produced the third graph shown here (coloured green/blue), based on the same data as all the others, but now showing by how much worse-off households will be after the rising costs of having to pay for essentials had been taken into account, alongside any tax and benefit changes. It was titled: ‘The poorest households will fall a further £2,300 a year behind the cost of living’ and showed that it was the poorest who would lose out the most, despite their benefits having been protected. By this way of looking at things, only the best-off tenth of households would be any better off by 2024 because essentials make up such a small proportion of their costs, and because the OBR expect these household to increase their overall income a little, even after paying slightly higher taxes (for instance by increasing the rent they charge their tenants, for those of them that are landlords).
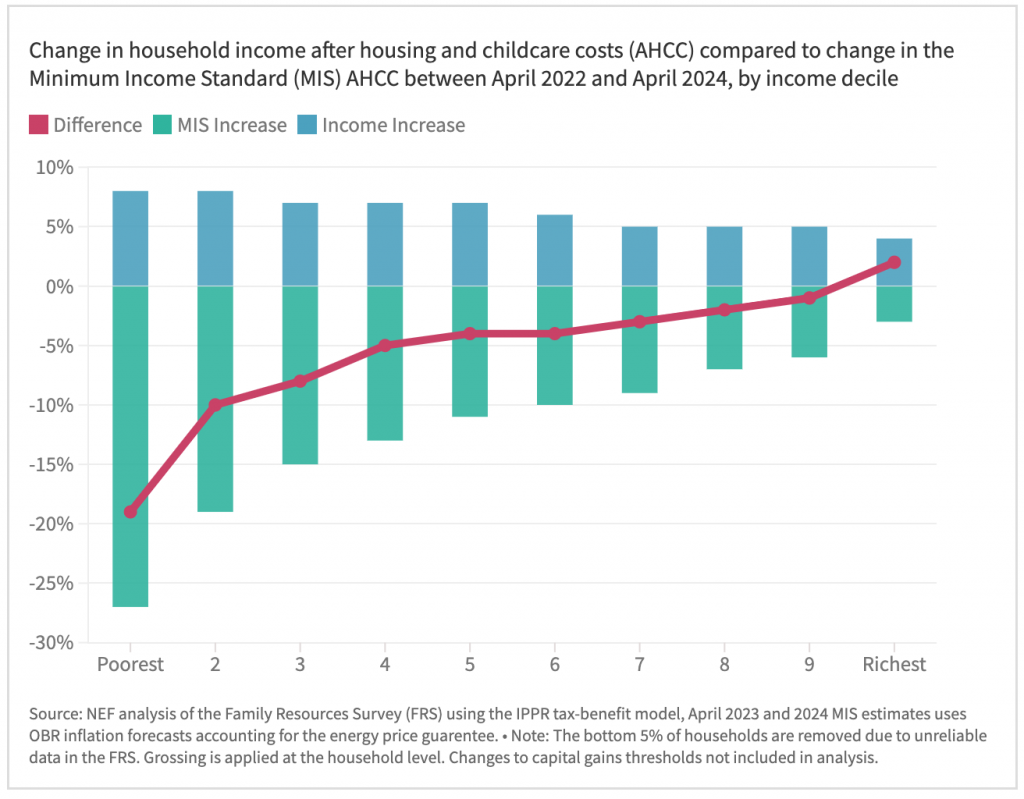
The distribution effects of the November 2022 autumn statement – NEF
Source: The New Economics Foundation
The NEF concluded that by April 2024, 37% of all UK households would be unable to afford the cost of essentials like putting food on the table or replacing clothes, while an additional similar proportion would be much worse-off than they had been a year ago, but still would be just about able to get by. The remaining quarter would be least affected, with a tiny few in their number becoming even better-off than before.
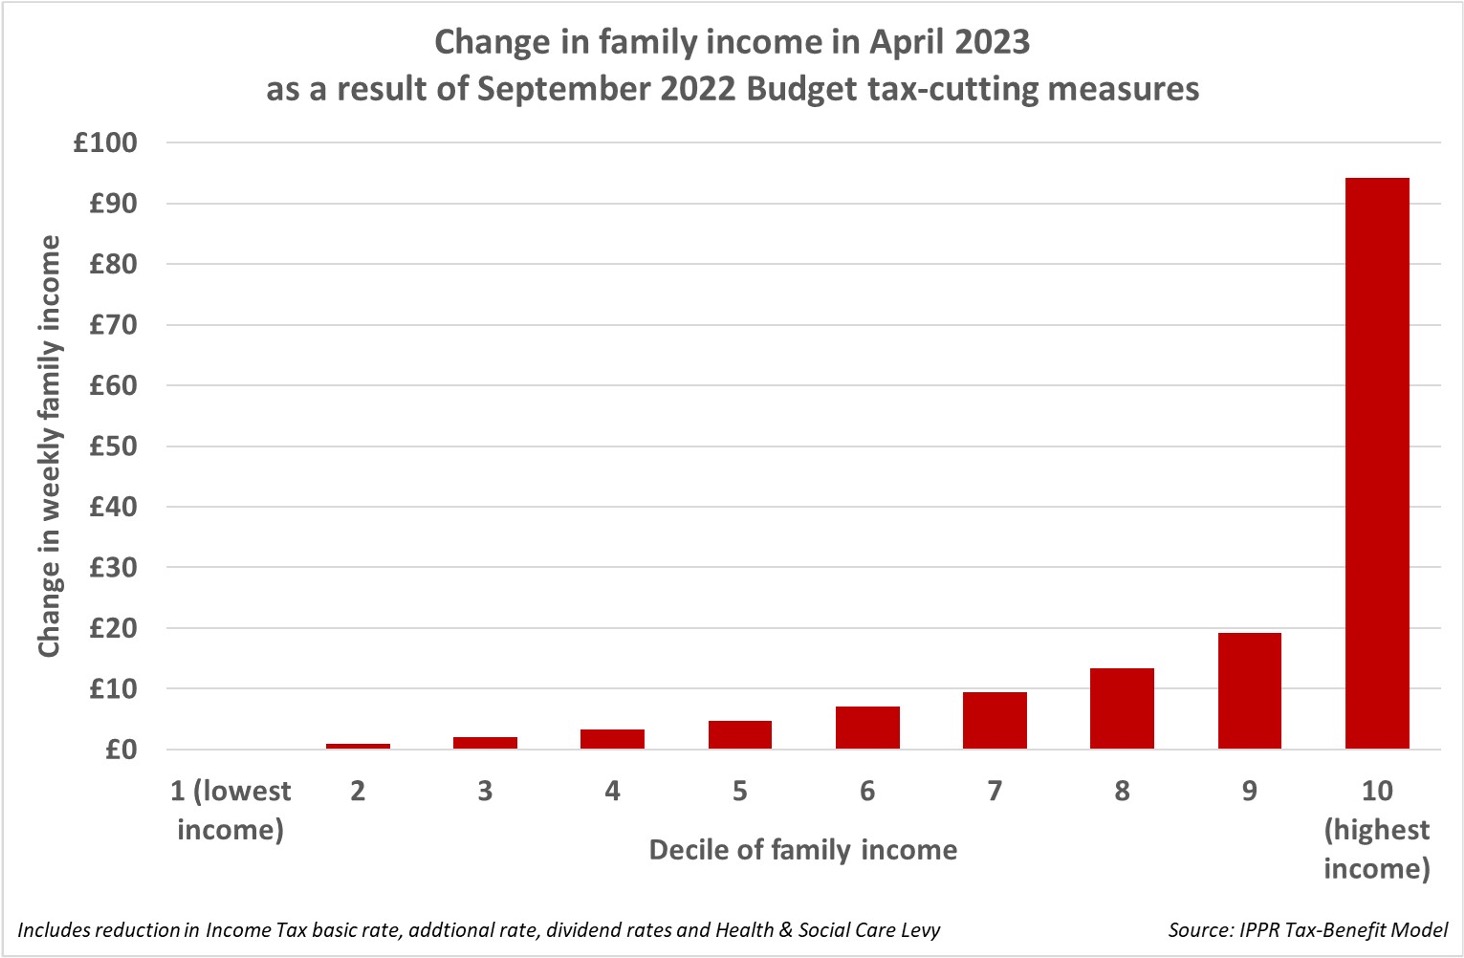
Finally, a fourth think tank, The Institute for Public Policy Research (IPPR), had waded in earlier, on September 23rd, after the mini-budget. The graph they produced back then had been far more simple, only coloured red. You can try to imagine what the overall situation of households living in the UK would have been if those tax cuts proposed in the disastrous September mini-budget had been enacted and the additional targeting of the poorest that the latter autumn statement had not taken place. Looking at this final red graph, and with the knowledge of the earlier three, you can see why even the international money markets reacted in horror at what Truss and Kwarteng were proposing earlier that autumn.

What the distributional effects of the September 2022 mini-budget would have been – source IPPR
All of the other think tanks (known collectively as Tufton Street) were largely silent on the November autumn statement, having heralded the September mini-budget as a resounding success. It had been their own former employees who had devised that catastrophe and who in many cases had been forced out of their special advisor and civil servant jobs shortly after it was announced, but a few still remain. Jeremy Hunt and Rishi Sunak are not that different from Kwasi Kwarteng and Liz Truss.
Most of the ensuing media debate was about Middle England. The other countries of the UK were not much mentioned (that contain fewer of the very best-off), nor that the poor would suffer most and some bankers least. Unlike the mini-budget, the autumn statement will have increased income equality a little, it is just that we will be mostly both a little more equal, and all much worse-off; except for those at the very top who have been most protected still – for now.
Who knows what winter will bring and what the actual spring budget of 2023 will be? A solidarity tax on the wealthiest 23,000 families, as Spain introduced in 2022, is unimaginable to many who live in Middle England and still mostly support the Conservatives today. But it might soon be hard to dismiss so easily.
For a PDF of this article and its original place of publication click here.