The share of people working in public service
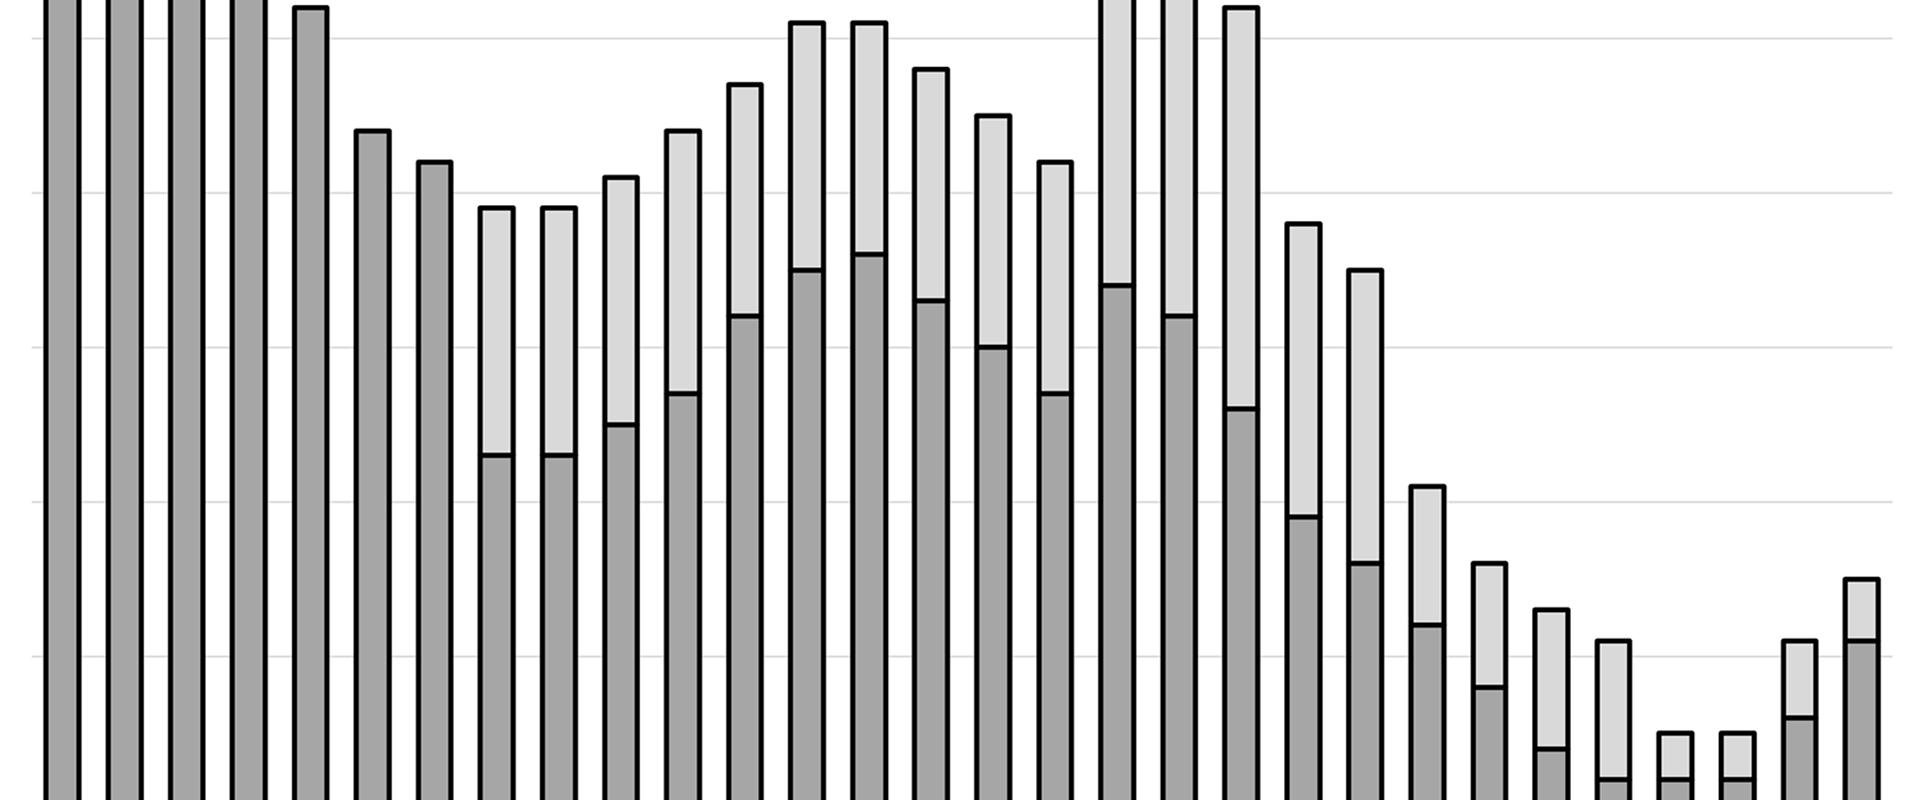
The government could, if it wished, claim that in 2021 it was employing more people in public sector jobs than John Major did. The government could claim that the increase in public service employment under its rule in recent years has been large. They could point out that Mrs Thatcher’s governments only ever cut public service jobs. They could say that an extra 324,000 jobs in public service have been added since the 2017 General Election, an increase by 2021 of 6% on the total employed in the public sector as compared to that 2017 year. They could say all of this, and each fact they presented would be true – but it would miss the point. The point being that they would not be comparing like with like. There are today far fewer public sector workers per person, or per worker, or per pensioner than there have been for many decades.
Source: ONS “Public sector employment time series”.
Figure 1 shows one measure of the number of public sector workers in the UK. This measure fell to a low of 5.05 million in 1998, rose to a maximum of 5.75 million in 2010, fell again to just 5.15 million in 2016 and then rose again so that when most recently counted for a whole year (2021), it stood at 5.48 million. In the final quarter of 2021 it was even higher: 5.52 million. These are the statistics government would use if it wanted to make claims of expansion. The numbers that Figure 1 is based on come from the ONS “Public sector employment time series”. It is updated quarterly and begins in 1992.
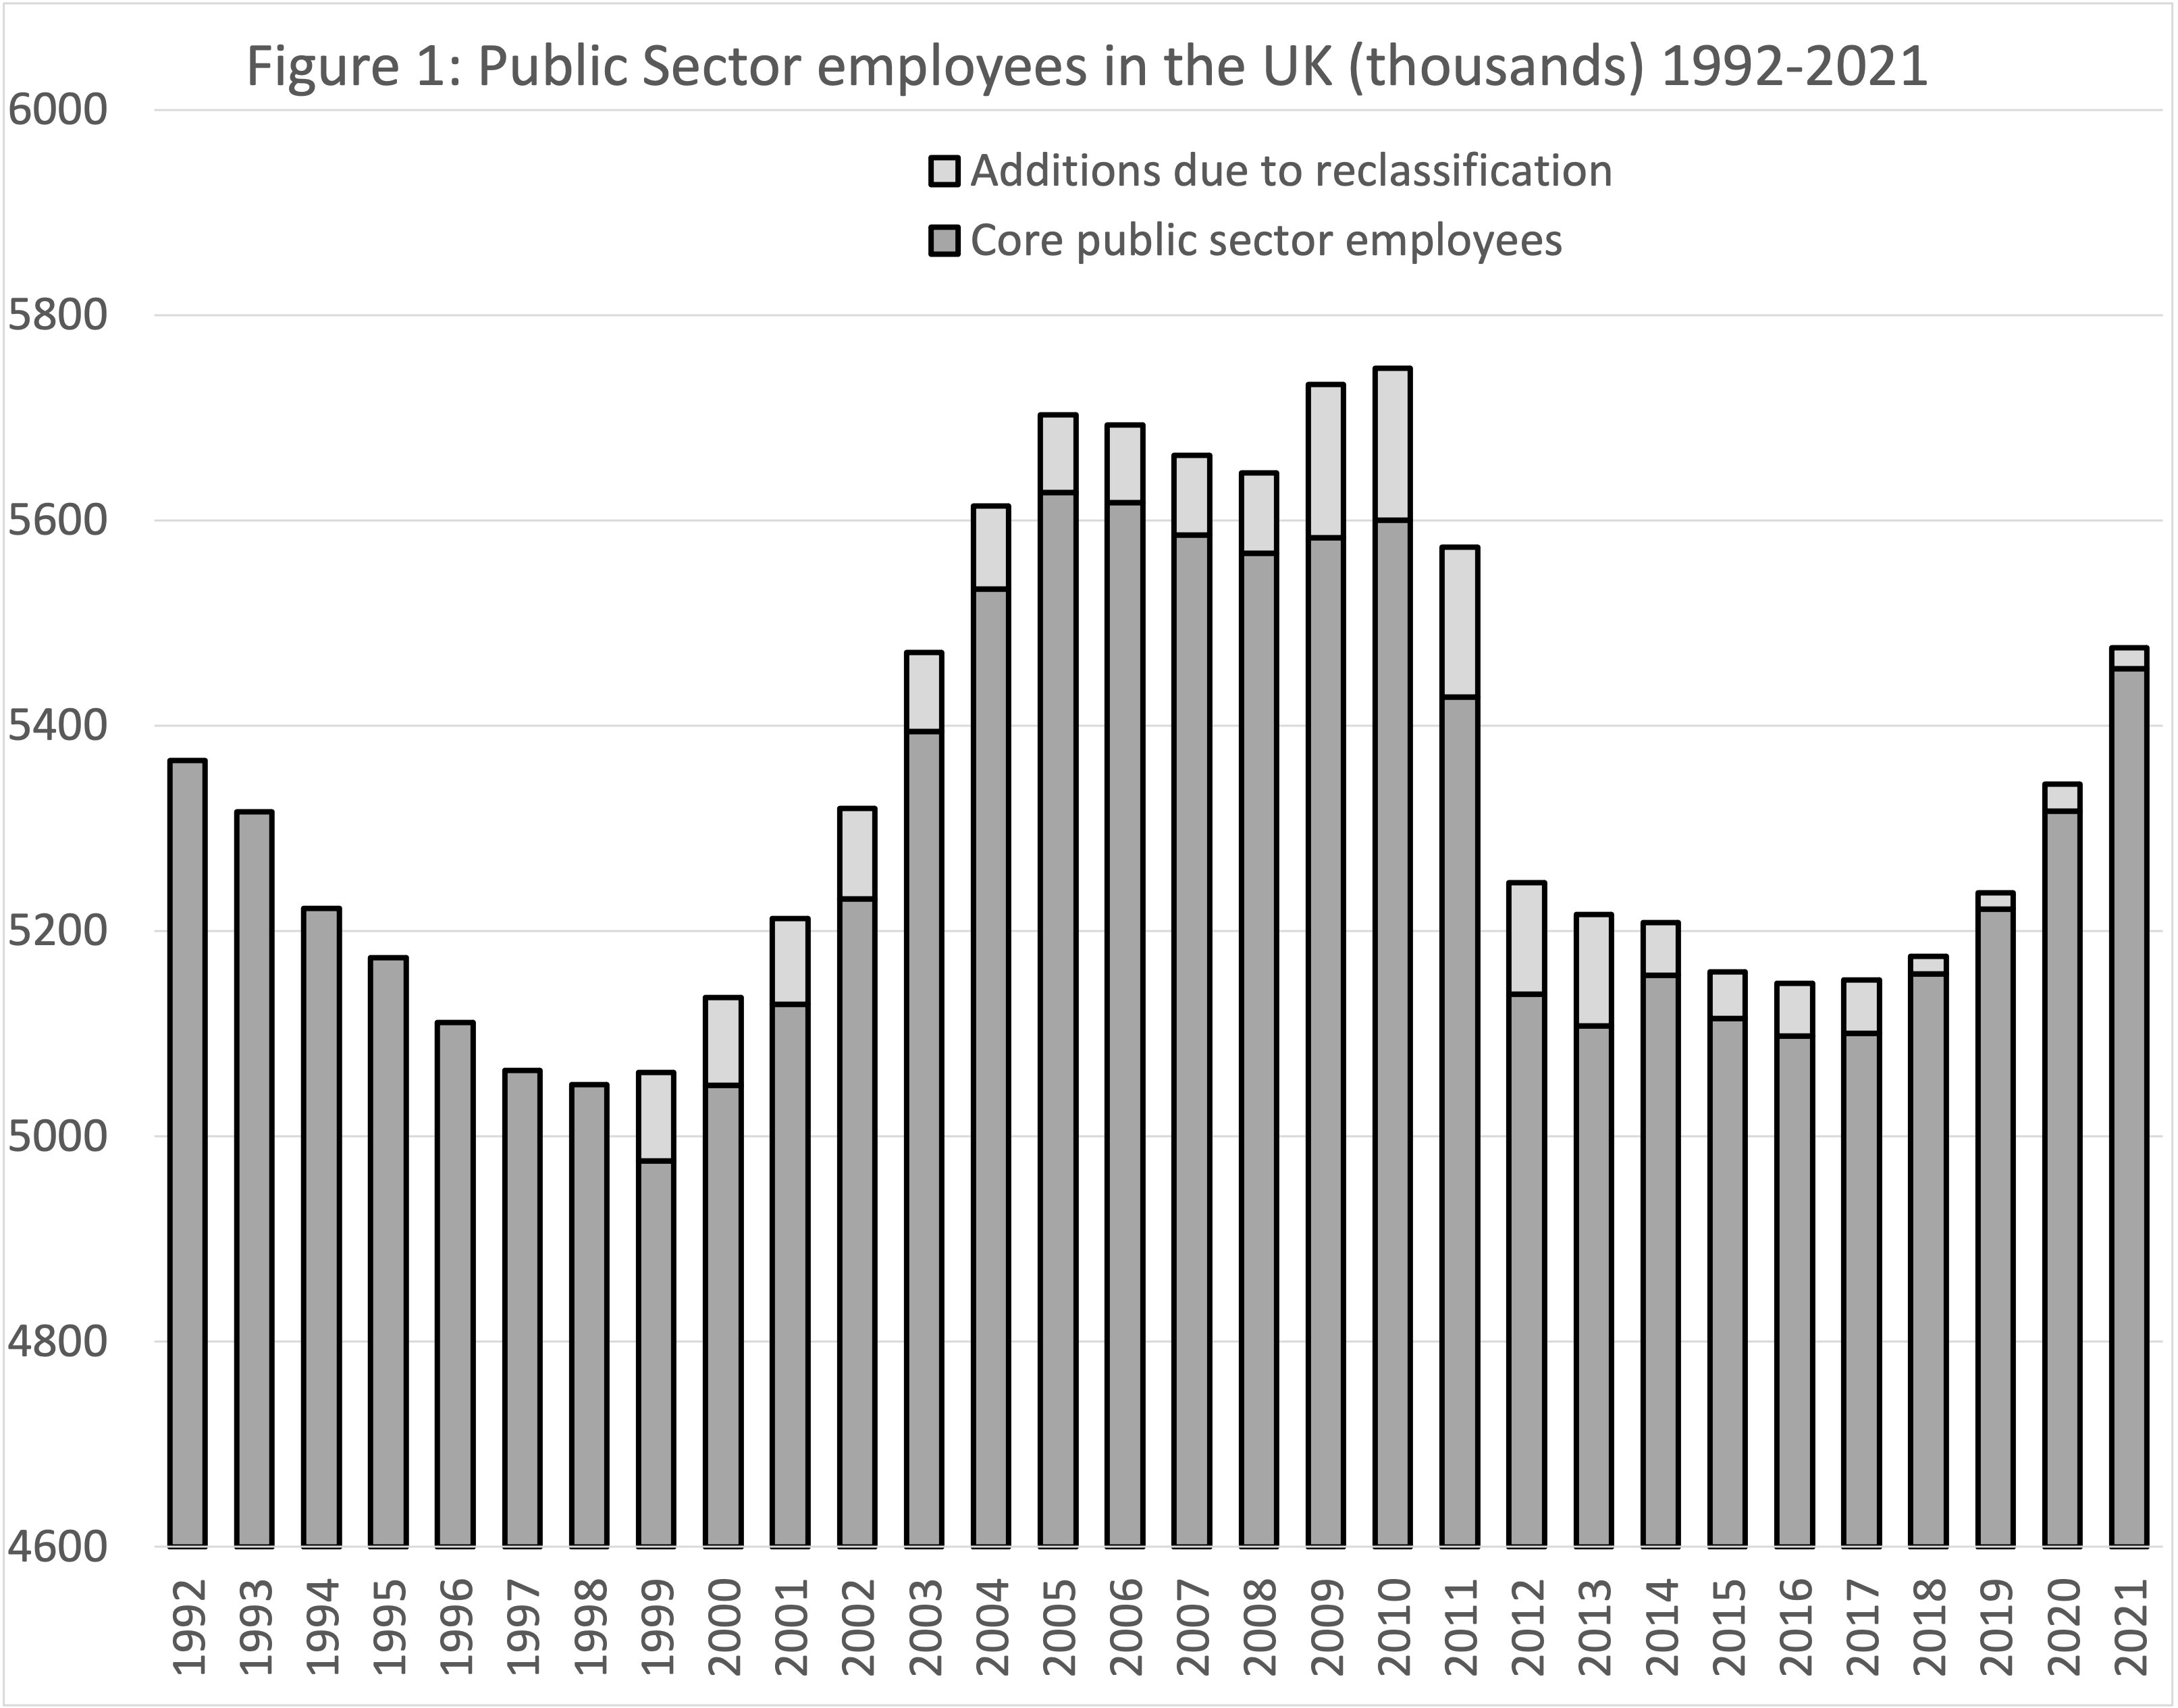
So why is it so misleading to quote the absolute counts of public sector employees? The reason is not because it is so hard to count this sector, although when universities are privatized, or banks and rail companies are nationalised, some reclassification of jobs has to happen (the extent of which is indicated in Figure 1). The reason that it is misleading just to compare counts is that the size of the population changed over this period. There were more members of the public to be servants to. Because of this Figure 2 shows the same data as Figure 1, but now with the height of each bar proportional to the percentage of all employees in the UK who work in the public sector. This percentage has fallen from just over 23% in 1992, to be just over 17% in 2021. Looked at in this way, as a share, a very different picture emerges.
Source: ONS “Public sector employment time series”.
There are now far fewer people at the Town Hall to deal with your enquiry about car parking permits (for every one of you with a car). There are fewer police officers, fewer teachers working as a share of everyone working. More and more often there are fewer teachers per child in each state school in the UK.
What Figure 2 shows most clearly is that the private sector has grown, rapidly, from providing just under 77% of all jobs in 1992, to providing over 82% in 2021. In most cases the new private sector jobs are not replacing the public sector share that no longer exist. The new private sector jobs are almost all in services and in sales: in retail, in telemarketing, but they are also in private care homes and private nurseries, in private hospitals or staffing and building private cark parks; providing private security, private finance, private university halls of residence, private cleaning contractors, more private doctors, nurses and teachers (but only for those who can afford to pay).
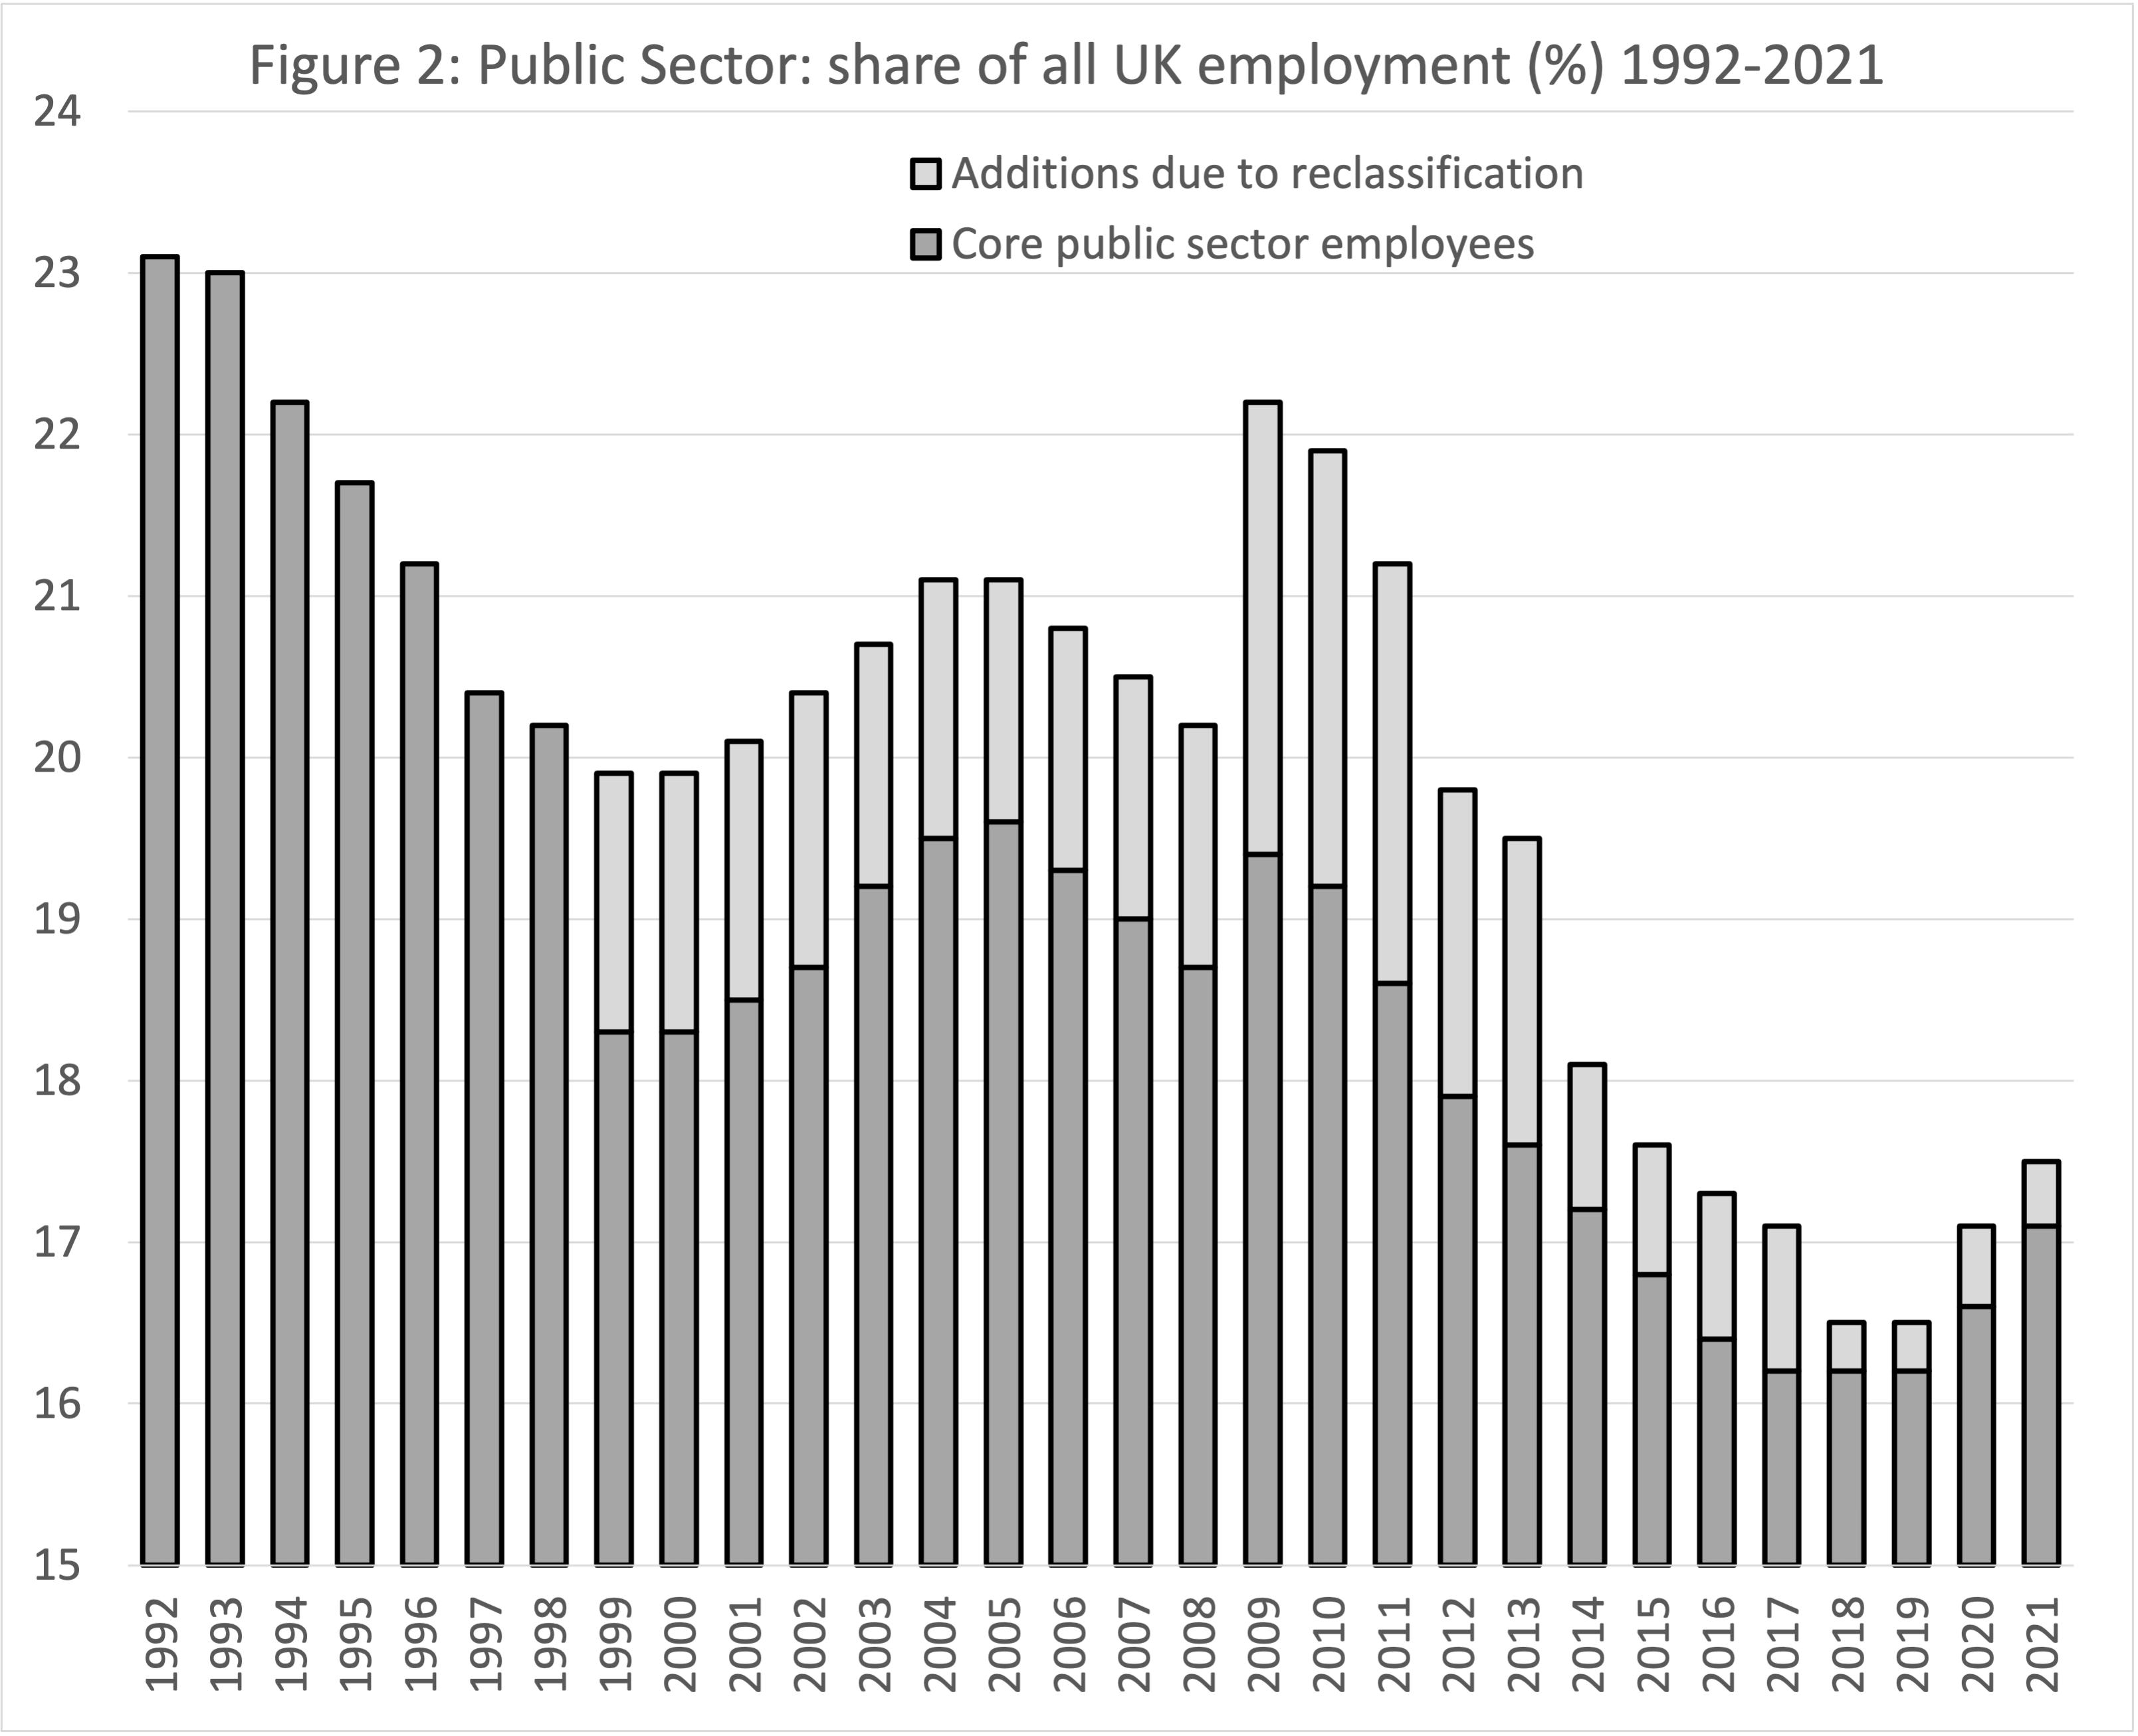
We can add a little more detail to what has been lost from the same sources as is used to draw Figures 1 and 2 and by applying the overall percentage total to the occupations which that source tallies. Figure 3 shows the result. The lowest line in the figure is for people working on construction jobs in the public sector – building for the public sector and employed by the public sector to do so. In 1992 0.6% of all employees in Britain worked in such jobs, but by 2021 that had fallen to 0.1%. The next smallest group is the armed forces, down from 1.2% of all people in work in 1992 to 0.5% in 2021. The police are also down as a share, from 0.9% to 0.8% (this is everyone who works as a public servant with the police, not all of whom will be police officers). Figure 3 also shows that in 1992 there were almost two public servants working in other health and social service roles for every one working in the police. Now there is less than one – a fall from 1 in 60 employees in the UK working in such public sector jobs in 1992, to fewer than 1 in 150 by 2021!
Source: ONS “Public sector employment time series”.
“Other public services occupations” are a great amalgam, which have more than halved in their share of employment. This group rose briefly when some banks were nationalised during the banking crisis. In contrast those occupations labelled as “public administration” have seen slightly smaller falls. Many of these jobs are in local government and there was a slight rise very recently there as more employees were needed to deal with the pandemic. However, a closer look at Figure 3 suggests that the fall in public administration from 2010 onwards was almost as steep the fall in public sector jobs in education, almost all of people working in state schools (including academies); but this was a fall after a shallow rise. In 1992 some 1 in 20 employees in the UK had a public sector job that had something to do with education. That had risen to 1 in 17 by 2010, but had fallen to 1 in 22 employees by 2021. In contrast, the NHS saw a small employment share rise under the New Labour government of the early 2000s and then another rise during the pandemic. However, the rise in employment in the NHS has been far smaller than the rise in the needs of an ageing and increasingly ill population, a population with so much less state social care to fall back on.
The final graph in this series, Figure 4, shows where the relative cuts have been greatest. Local government bore the brunt of the repeated decimation. Between 1992 and 2021, more than six times over, local government’s share of UK employment was reduced by a tenth. It was decimated at least six times in those thirty years. Similarly, the traditional civil service also fell greatly, from 2.6% to 1.6% of all GB employees in these thirty years – which was also six decimations before the very recent rise (to deal with the onset of the pandemic and Brexit). As a share of the total, the remainder of public jobs grew slightly – but only because of the inclusion of the NHS in that remainder.
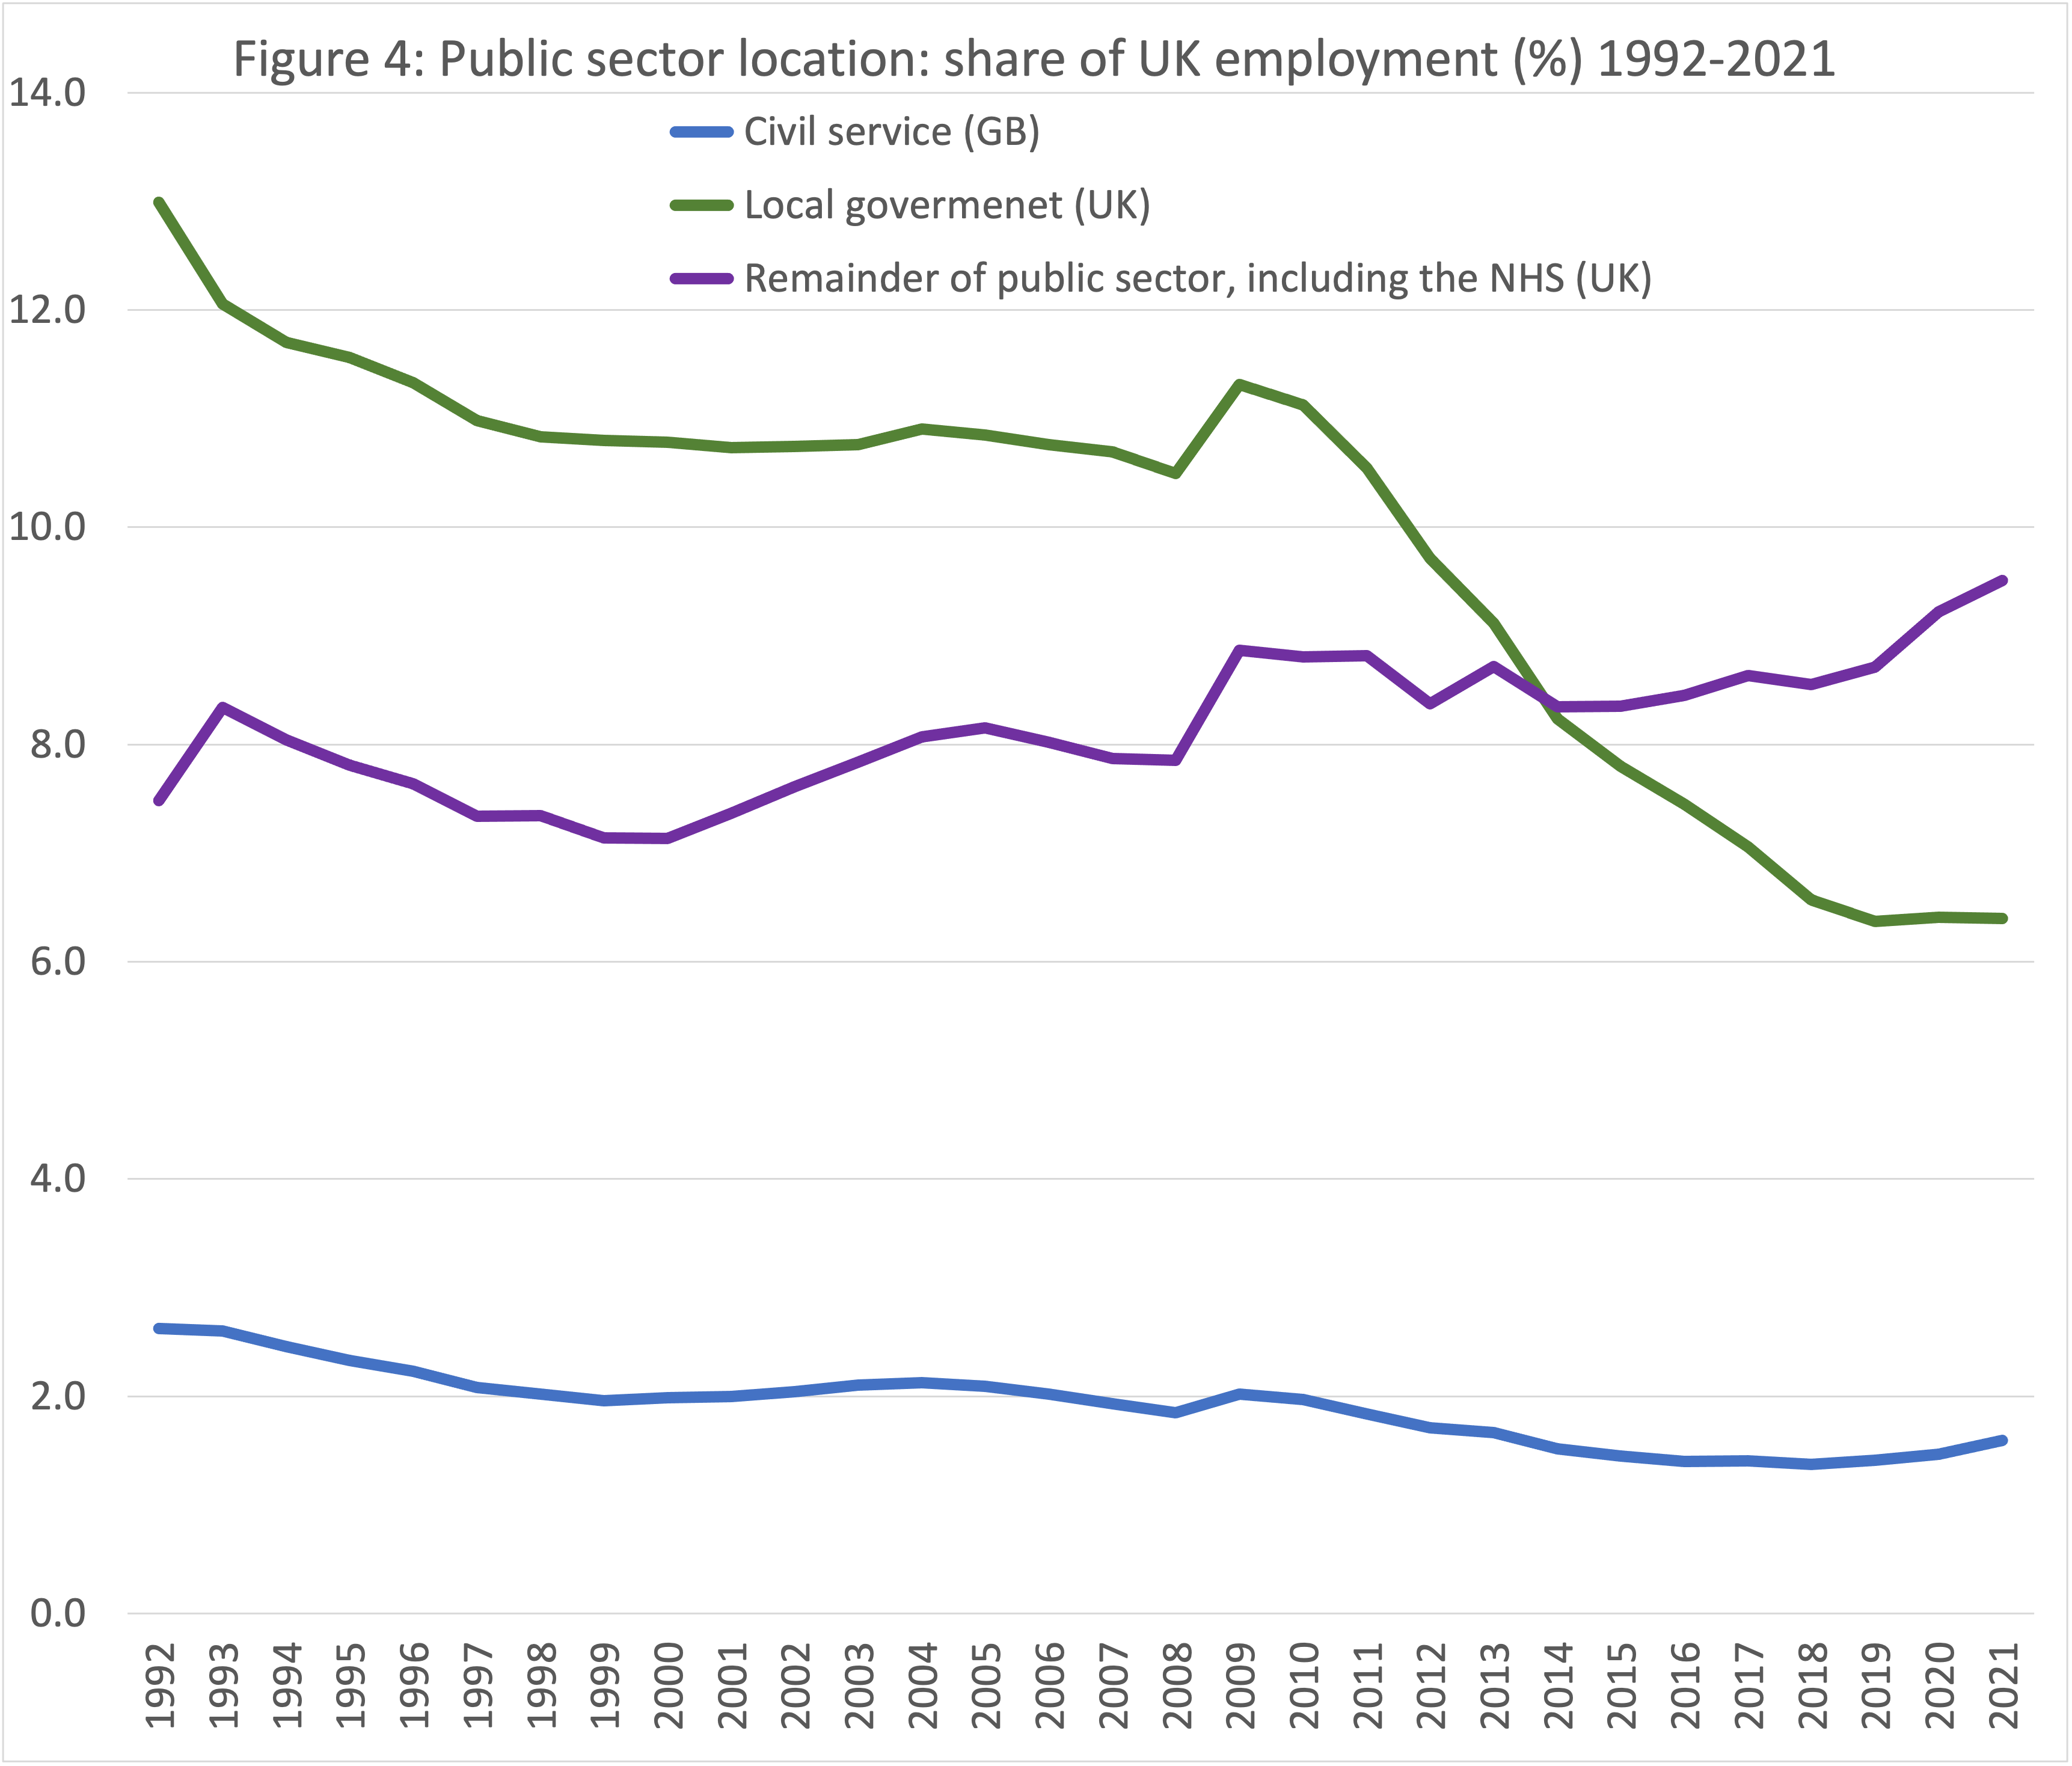
Source: ONS “Public sector employment time series”.
As I write, in late Spring 2022, the government are again talking of more public sector job cuts – especially in the civil service. They say that we can only afford the public sector because of the private sector and that the public sector is too large. A cursory glance at the size of the public sector in many other European countries reveals this to be untrue. More importantly, as the private sector has grown in the UK, rather than any increase in tax receipts from it being used to underwrite an even better public sector, the public sector has been repeatedly decimated.
Some public sector jobs have been replaced with private sector ones, but many others have simply disappeared and what used to be done is no longer done. Even more importantly, perhaps, what could be done in future is not even imagined. We spend so much time and effort trying to defend what we have, that we have no time or imagination left to think of what could be done better. We were unprepared for a pandemic. We were unable to care properly for those most in need before it, and even more so after it. We are no longer planning for a better future.
At some point these continual cuts will end – not least because we will reach the point where we cannot afford to carry on along this path. A society where the overwhelming motive for the large and still growing majority of work is the employers’ profit becomes an increasingly dysfunctional and impoverished society.
For a link to the published article and PDF click here.