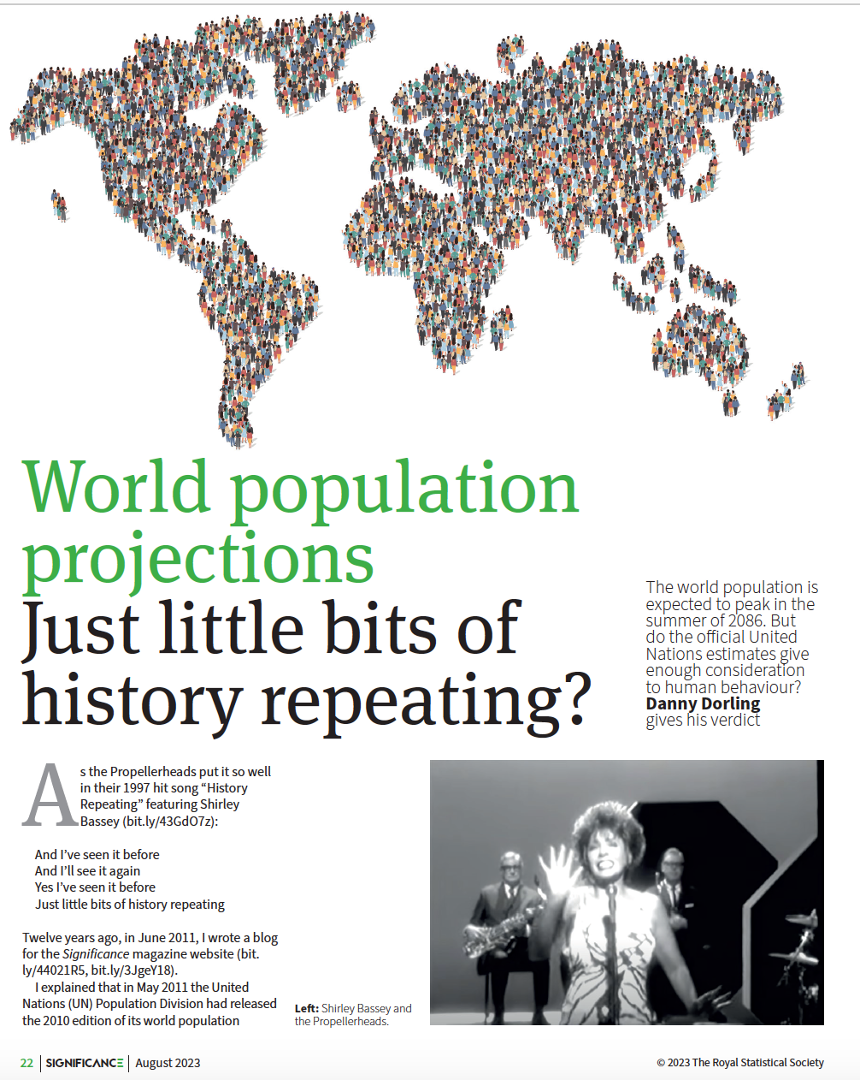
World population projections: Just little bits of history repeating?

The world population is expected to peak in the summer of 2086. But do the official United Nations estimates give enough consideration to human behaviour?
As the Propellerheads put it so well in their 1997 hit song “History Repeating” featuring Shirley Bassey
And I’ve seen it before
And I’ll see it again
Yes I’ve seen it before
Just little bits of history repeating
Shirley Bassey and the Propellerheads
Twelve years ago, in June 2011, I wrote a blog (part 1 and part 2) for the Significance magazine website.
I explained that in May 2011 the United Nations (UN) Population Division had released the 2010 edition of its world population estimates and projections. It was then thought that humans would number 10.1 billion within the next ninety years and 9.3 billion by 2050. I pointed out at the time how crude their methodology was. But it had to be simple when so many countries needed to agree with it and not be offended by estimates that might greatly differ from their own.
The UN press release came with both a health warning and a handy explanation of how they estimated a particular type of confidence limit: “Small variations in fertility can produce major differences in the size of populations over the long run. The high projection variant, whose fertility is just half a child above that in the medium variant, produces a world population of 10.6 billion in 2050 and 15.8 billion in 2100. The low variant, whose fertility remains half a child below that of the medium, produces a population that reaches 8.1 billion in 2050 and declines towards the second half of this century to reach 6.2 billion in 2100.”
I questioned why the medium variant projection had suddenly been raised. The reason appeared to be a mini baby boom during the first decade of the twenty-first century. Figure 1 shows the medium variant projection in millions of people (left-hand axis, thick curve). It also shows the first derivative of that trend – the rate of change in population, which for a global population is simply the births in one year less deaths in that year; (right-hand axis, thin curve). A black dot on the thin curve marks the end of the previously unexpected mini baby boom in 2011.
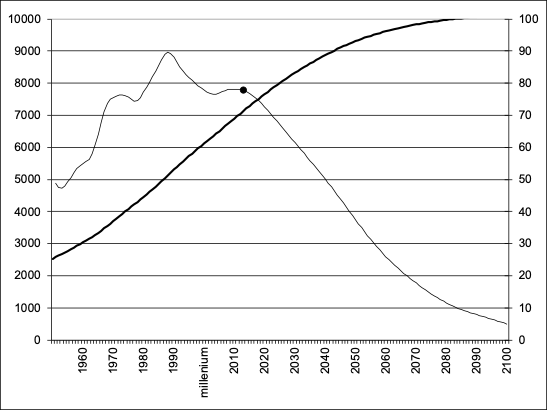
FIGURE 1: World population estimates and projections (left-hand axis, thick curve) and annual population change (right-hand axis, thin curve), UN 2011 medium variant scenario (millions).
I suggested that demography might be a complex science, but it is also an art. The sophisticated way to make projections is to calculate life tables and tables of fertility rates by age, and then to carefully project them forward year on year, and to do this for each country, maybe even trying to take into account international migration trends and their impacts. You then add up the results and publish your global projection. There are also far more sophisticated ways of estimating error than projecting that each couple has half a child more or half a child less; although the half-a-child measure does at least have colourful echoes of the judgement of Solomon, and an implication that choices might have to be made.
Turning to the art of demography, I suggested that demographers might consider the past trend and look at the change each year, and then the change in the change, to see if there was a pattern. Figure 2 shows the change in the change that the UN Population Division reports. This is of both estimates of what has occurred and projections into future, all in one thick line. It is the second derivative of population, the rate of change of the rate of change of our numbers. It is births in one year, less births the year before, plus deaths the year before, less the deaths this year. It is the degree to which population numbers are accelerating, when “change in change” is above zero, or the degree to which they are decelerating, when the “change in change” is below zero.
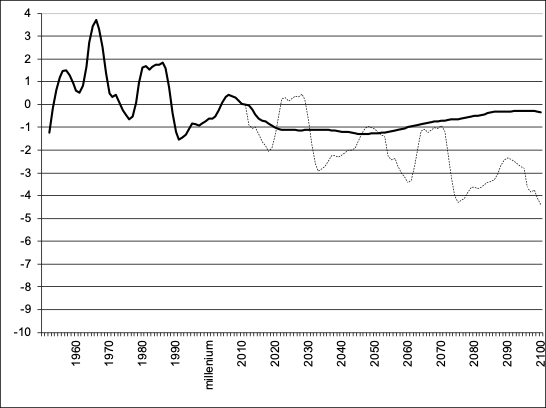
FIGURE 2: World population estimates and projections, annual change in population change (millions): UN projection (thick line) and alternative scenario (thin dotted line).
In 2011 the UN central estimate suggested that the greatest deceleration would only be, at most, about 1 million people a year and that this would flatten out towards no change in change by the century’s end. I asked the question: what if the future is as spiky as the past? I suggested demographers should look at the trend in Figure 2 of what we think occurred before 2011 and compare that to what is projected to come after.
The projection the UN was making was very smooth compared to the precedent. I debated over whether change in change is just too hard to project and, if so, whether the UN demographers had been sensible to suggest an asymptotic turn towards stability. Then I pointed out that we knew something about what we were trying to predict here. I said: “These are people, but they are being treated as if they were drops of water flowing in and out of a bathtub.”
It was clear in 2011 that the length of time between the most recent peak in Figure 2 (2006) and the one before it (1986) had been 20 years, and the one before that (1966) had also been 20 years. I suggested it mattered that these were people, not baboons or fruit- flies and not water running in and out of the tub. I suggested that the peaks and troughs in the rate of change of the rate of change represented mini baby booms, the echoes of past larger booms and busts, and then I asked, what if those peaks and troughs were to repeat? That is what the faint dotted line in Figure 2 illustrated. It was a projection based simply on repeating, from 2012 onwards, the last 42 years of peaks and troughs. It is just what you get with, literally, a little bit of history repeating. Why 42? Because that takes us back from the year 2011 to 1969 and best matches the last point in time we were in a similar point in this cycle. The peaks may have been each 20 years apart: 1966, 1986 and 2006; but the last two cycles themselves appear to average nearer 21 years in length.
I suggested that many of the children of 1986 had recently become parents (around and shortly before the year 2010). They in turn, were more numerous because of the worldwide baby boom of 1966. And so we should expect a further smaller boom around 2026, 2046 and on, perhaps becoming more spaced out in time as the average length of each cycle increases because more people have their children later in life, and hopefully also damping down as compared to the strict repetition shown by the dotted line in Figure 2.
Back in 2011 it was clear that the introduction of a little bit of variation has a huge impact on how population changes in future. That is shown in Figure 3, with the dot again marking where we were in 2011. The trends from 1950 to 2011 are identical, but under this alternative scenario, births decline just a fraction more rapidly because, between the booms of the past, there were troughs which we currently ignore as we project forward from a time of boom. That potential error has great cumulative effects.
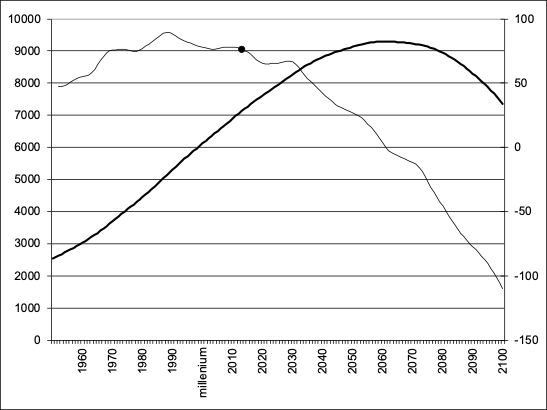
FIGURE 3: An alternative scenario of world population estimates, projections and annual population change (millions) based on the idea of a little bit of history repeating. Published by the author in 2011. Change per year in millions per year is shown on right hand axis and drawn as thin line on the graph.
As Figure 3 shows, if the change in change repeats the most recent little bit of history we have enjoyed, then a human population maximum is reached in 2060 at 9.3 billion, but by 2100 there would be just 7.4 billion of us. We would be back down to total human numbers last seen around the year 2016.
Many might hope that the falls were not as abrupt as those shown in Figure 3. You only have to continue that rate of decline onwards another 38 years and we would all be extinct. A fall to fewer than 7.4 billion humans by the year 2100 may appear rapid, but it is a slower fall than the UN Population Division’s own low variant projection, which was for world population to fall to 6.2 billion by 2100. It is remarkable that the UN endorsed projections that varied by some 9.6 billion people (15.8 to 6.2) in just the 89 years after 2011; and as the story below explains, we still really do not know what will happen.
The UN was born out of a world war with the mission to stop history repeating – above all else, to try to prevent the repetition of war and the harm another world war would cause in affluent countries. World war tends to result in baby booms, as did the partition of India and the revolution in China which were both, in effect, wars involving many millions. If you are looking for the origins of the mini baby booms then look back to those events of the 1940s, and earlier.
So, what have we learnt in the last dozen years? Figure 4 shows Figure 1 updated to include the most recent 2022 UN projections. The main projection is now for population to grow a little higher, as shown by the thick brown line, but peaking at 10.4 billion people in the summer of 2086 and then falling slowly. This does not cause great concern today because between 2011 and 2022 the UN predicted even higher growth and then revised its estimates down, so people are now surprised that the population is projected to fall by the end of the century, not that it is projected to be higher for most of the century than it was thought to reach (in the near future) back in 2011.
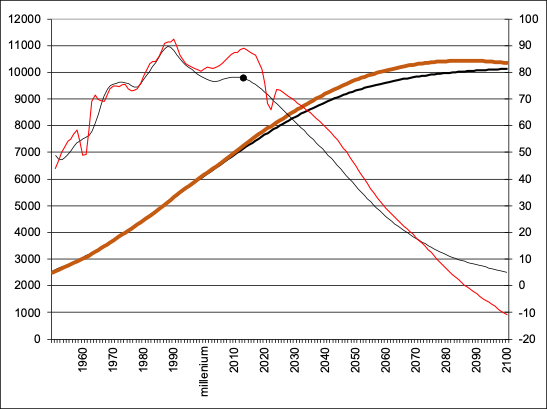
FIGURE 4: Two sets of official world population estimates and projections – also showing projected and past annual population change (all numbers in millions). The first of these is the UN 2011 median variant scenario (thick black line). The second is the UN 2022 based scenario (thick brown line). The scale for change per year in millions is shown on the right-hand axis and drawn as two thin lines, in grey (the UN 2011 based estimates) and red (the UN 2022 based estimates).
The thin red line in Figure 4 shows how the change in population is now thought to be different from that believed to be the case in 2011. Note that it is not just the future, but also the past, that has been revised. The global projections are now higher in the short term because there were more babies born around 2010 than the demographers in 2011 knew (and a few fewer people dying than they thought).
The sudden drop in the thin red line around 2020–22 is the UN estimate of 8 or 9 million more deaths a year due to the pandemic in these years, and about 3 million fewer births a year during these years. But after that, the projections are for a rapid return to normal, albeit higher population growth than was projected in 2011 in the next four decades; but then much lower growth and actual decline.
So, how has the picture changed in a dozen years? Figure 5 shows the “change in change” each year as originally drawn in 2011 (in black), and as updated (in orange and red). The orange line shows that we were far too certain about the past, in the past.
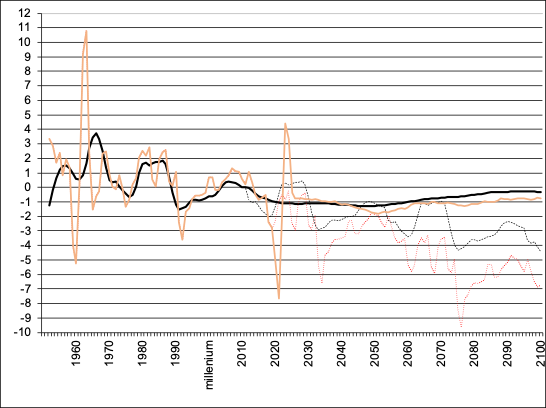
FIGURE 5: The revised alternative scenario of world population estimates, projections and annual population change (millions) based on the idea of a little bit of history repeating. The original UN 2011 world population estimates of change in change are shown as a thick black line. The first alternative scenario published in 2011 is drawn as thin dotted black line. In orange and dotted red: the same two lines, but based on the UN 2022 data instead. The thick orange line is the UN estimates of change in change published in 2022. The dotted red line is the most recent alternative scenario of what happens now with a little bit of the (recently revised) history repeating.
It turns out that the past had been even more variable than the UN had been reporting. Nowadays, the great famine of China (1959–61) can be included, whereas the UN had to pretend a dozen years ago that it had not happened, and the baby boom that followed that famine also had to be ignored. Between 2011 and 2022 it was quietly accepted that this story could be included in the global demographic record – China now much more openly accepts that there was a great famine.
What is interesting about the 2022 revision is that the UN projections for change in change are now always lower, from 2043 onwards, than they were a dozen years ago. But what is more interesting is how my alternative scenario changes. Here that scenario is started just before 2020, as if the pandemic had not occurred (otherwise the effects of the Covid-19 pandemic would be repeated in future, every 42 years, in the new alternative scenario). The same periodicity is used as before and so the dotted red line in Figure 5 repeats every 42 years, just as the higher dotted black line did. Why still chose 42? As explained before, it is roughly two generations in length, or was in 2011, and I am tempted to stick to it for now, partly because 42 is the number that Douglas Adams once explained was the answer to life the universe and everything. More seriously, as we have fewer and fewer children in future globally, we may not continue to have them later and later in our lives. We may want to meet our great- grandchildren. What is key is that the slight drop in the dotted red line in Figure 5 has a huge effect overall, as is shown in Figure 6.
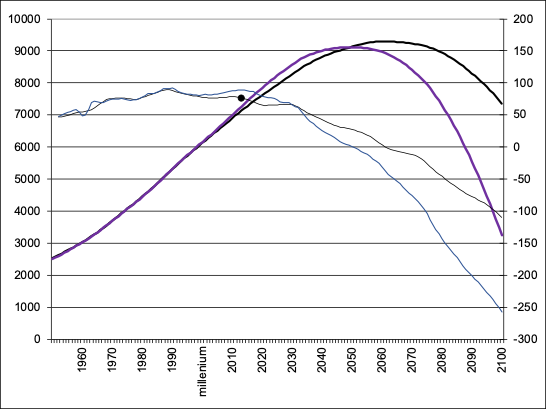
FIGURE 6: The implications of the revised alternative scenario of a little bit of history repeating. In black, the thick line shows the original 2011 based alternative scenario for our total numbers each year. The thin black line is annual population change under that original alternative scenario. All numbers are in millions and the scale for annual rates of change is shown on the right-hand side. In purple is the new 2022-based alternative world population projection based on the updated alternative scenario, and the thin blue line is the annual change that updated scenario suggests.
The black line in Figure 6 peaked in the year 2060, a little ahead of what the UN demographers now say will be the peak year. When I made that prediction in 2011 it turned out to be more accurate than the one the UN was making. At the time I was predicting that its projection would soon bend down towards mine (it did). However, as the purple line in Figure 6 shows, using exactly the same method and exactly the same time intervals, I would now end up predicting global population to peak in 2050, ten years earlier than I did before, at 9.1 billion.
Back in 2011, I had suggested it would reach 9.3 billion in 2060. That may not be bad news – the planet could happily fit a few fewer people on it, if they behave well – and behave better than a few of their parents and grandparents have in burning so much fossil fuel.
However, worryingly, this little-bit-of- history-repeating method suggests that if history carries on repeating as we know it has done most recently (prior to the pandemic) then soon the global human population will fall to below 9 billion in 2060, below 8 billion in 2075, below 7 billion in 2082, and rapidly down and down to below 4 billion in 2097. That would be extremely unlikely. It is the kind of scenario predicted in P. D. James’s 1992 novel, The Children of Men.
History will not carry on repeating, but it may repeat for at least one more cycle, a couple of generations, yet. All the signs currently suggest that the peak in global human numbers will occur earlier than the UN currently predicts. Fertility is already lower now in 2023 than it predicted in 2022 – the pandemic did not result in a baby boom. Mortality is higher – the pandemic has not gone away, mortality remains higher than expected, and there are reasons to believe it will continue to be higher than we thought in the past. But those two things are not what will matter most in future.
What matters most is security: social security. If people feel secure then they tend to have fewer children. If there are not large or never-ending wars, they tend to have fewer children. If adequate pension schemes are maintained, they tend not to have as many children. If they do not see their own children die, they tend to have fewer children. If they live longer, they tend to have fewer children. And all of that could be disrupted by war, famine, economic collapse, disease, or any of the other variants on the “four horses” that we have feared so much, throughout almost all of human recorded history – resulting in more, not fewer, people despite the initial population falls.
The effects of climate change, medical innovations, food availability, and many other factors may all play a role. However, as yet we really have no idea how climate change will influence patterns of migration, let alone births or deaths. Instead we speculate a great deal. Migrants often have fewer children if they move to an area where that is the norm. Medical innovations may in future make it easier for people who find it hard to have children to become parents later in life. Food availability is an ancient concern in demography, although it is only in recent decades that we have come to realise that increased food security reduces our numbers as we become less afraid of the future and have fewer children.
A crucial factor is changing cultural norms, especially the role played by education in this. When those around you are having fewer or no children it is much more likely that you will too. A norm of people having no, one, or (more rarely) two children – and only very occasionally more – is becoming very widely and very quickly established over an ever increasing share of humanity. A few economists still ask how a country like the UK can enact policies to raise the British total fertility rate to 2.0 as a grand societal challenge (see, for an example, a comment from the executive chair of the UK’s Economic and Social Research Council, 31 May 2023). However, increasingly, social scientists have come to realise that such a medium-term aspiration is unnecessary, very unlikely to be achievable, and could well not be beneficial.
If we would like population to peak earlier and lower than 10 or even 9 billion, we need to focus, as the UN does, on security. A very large part of that security, the most important part, is the position of women in any society. The more power women have, the faster births fall. Many years ago a survey found that the average woman in the world would like half a child less than the average man. When she can secure that, we slow down faster. Improvements in health can also increase our population numbers – as more of us are then hanging around for longer. But the effect of those improvements on reducing the number of children we have is probably now greater than the increase in population numbers that lower mortality results in.
There is almost no evidence from anywhere in the world that the number of children a couple (on average) have can easily be raised to 2 or maintained at that level, rather than being a fraction below it; but a great deal can be done to help people who want to have an average of around 1.7–1.9 children per couple rather than averages of around 1.3 or even lower. In Japan this year, the debate over what a decent level of state child support would be has intensified, but so too has the discussion about the benefits of encouraging more immigration (s.nikkei.com/3CBNa3O). In Scotland in November 2022, the raising of the Scottish Child Payment to £25 a week per child aged 16 or under whose family receives any form of benefit is now one of the most progressive reforms in Europe to both reduce child poverty and make it a little easier to be a parent. However, greater social stability and equality tend to result in fewer births.
What, though, of the falls predicted after 2050? The UN has always had an assumption in all of its scenarios that we will, in the long term, magically move towards a world in which every potential couple on the planet will have, on average, two children. That implies that actual couples will mostly have more than two, because an increasing number of people do not have any children, or just one, and many are not in couples of any kind today. Increasing numbers of people are now single for the majority of their lives.
I suspect that the UN scenario is over- optimistic and we will not see a return to a two-child average anywhere soon in all of those countries where it has fallen below that. They are where most people in the world now live. Pro-natalist policies may raise average numbers of children in some places from say, 1.4 to 1.6 children per couple. Immigration could be encouraged to prevent population decline, but only while there are still places with rapidly growing populations.
At the extreme, the population of South Korea is now more than halving each generation as the average number of children per potential couple there is well below 1. But whereas the UN projection may be too optimistic, mine is almost certainly far too pessimistic – or is modelling a future that will (optimistically!) be far more politically, socially and economically stable than what we might well experience. This is because the 42 years from 1978 to 2020 were a more stable period of human history than any previous 42 years seen for many centuries. The previous 42 years included world war (with the years 1936–78), as did the 42 years before then (1894–1936). The 42 years before then included the great famine of India and a myriad of other horrors that we now understand were largely products of colonialism and imperialism (1852–94). I could go back to the effects of the beginning of the Atlantic slave trade, the destruction of almost every stable social human system on earth following European settlement, the earlier effects of the enclosure of land within Europe; but hopefully most people now realise that our global numbers first exploded because of our choices and actions and that they will stabilise and fall faster depending on how we collectively behave and what we now understand.
For my projections to come true, hundreds of millions of young people would have to decide right now, and in the next few years to come, that they were not going to become parents. That is unlikely. But we should perhaps begin to worry more about why fewer people are having children. One good way to worry is to look at the purple line in Figure 6. Becoming a parent should not be a financial strain on adults. It should not mean you are much more likely to live in poverty in future. Note that in 2023 a majority of parents in the UK with three children now go hungry at times).
It is social security that matters in both the short, medium and long term.
What happens to us depends far more on our behaviour than our numbers, and our behaviour depends greatly on what we understand. This is why it matters whether our recent past suggests there are trends in our collective behaviour we are still not aware of. Too many people worry that there are too many people. A tiny proportion (less than 10% of us) are responsible for almost all the pollution on the planet. A large number of us need to begin to realise that it is the choices being made today – by the potential parents of the elderly of 2100 – that will actually decide all this.
For where this article was original published, and a PDF of it, click here.
Dorling, D. (2023) World population projections: Just little bits of history repeating?, Significance Magazine, Volume 20, Issue 4, August 2023, Pages 22–27, https://doi.org/10.1093/jrssig/qmad062