The never-ending pandemic

The pandemic is not ending—and it may not end in our lifetimes.
There are already improved treatments for Covid-19 and associated mortality will probably be lower in future. As our immunity wanes, however, most of us are likely to carry on catching this illness, again and again. Others may well feel obliged to shelter—especially those who are most vulnerable and even among those repeatedly receiving booster vaccinations.
This is the reality we are now having to face, worldwide and across Europe. We know this because of random surveys of the prevalence (current burden) and incidence (new cases) of infection.

Alonafoto/shutterstock.com
One of the first surveys to test a random sample was in Spain between April and May 2020. It discovered that by then just over 10 per cent of the population of Madrid had caught the coronavirus and 5 per cent across Spain as a whole. A longitudinal survey in Portugal found that as of March 2021 17 per cent in that country tested positive for viral antibodies.
Between those two studies, at least another 23 were organised across Europe. They reported hugely varying rates of infection. These ranged from less than 1 per cent of blood donors in one part of Germany to 23 per cent of people in the Lombardy region of Italy, especially hard hit early on.
Small-area data
A weekly survey began to report in England, with data being made available for small areas from November 2020. Figure 1 shows the proportion of a random sample who tested positive for the disease each week in England during the second wave.
Figure 1: people in 116 areas of England with Covid-19, November 2020 to March 2021 (%)
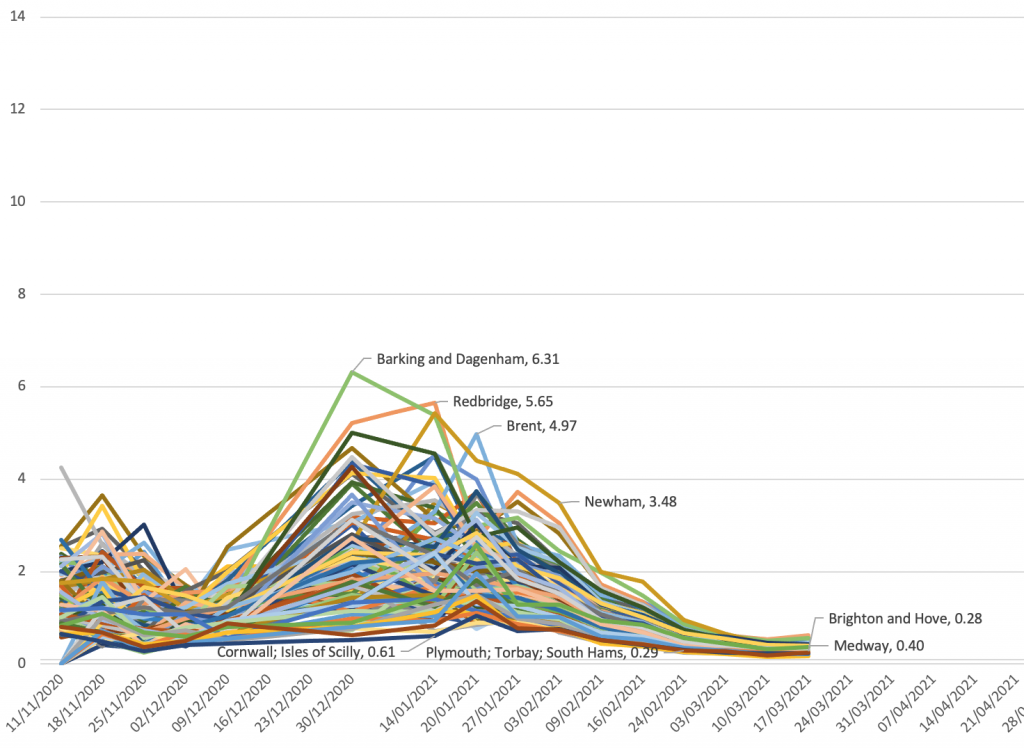
Source: Organisation for National Statistics Coronavirus (Covid-19) Infection Survey
The figure helps explain why the one-off surveys carried out across the rest of Europe varied so much. The four labelled places with some of the highest rates were all parts of greater London where, at its height, as many as 6 per cent of the local population were estimated to be infected in one week during the second wave. Cornwall and Plymouth are remote parts of the south-west of England, with very low rates at this time.
Figure 2 extends the time series. (When rates of infection became low, in the summer of 2021, they were not released for these small areas and so there are gaps, as also over Christmas 2020 and 2021.) One can see why some thought the disease might be eliminated when it became less prevalent and that vaccines would greatly reduce transmission (not just symptoms). The right-hand end of Figure 2 shows this was however not to be the case.
Figure 2: people in 116 areas of England with Covid19, November 2020 to March 2022 (%)
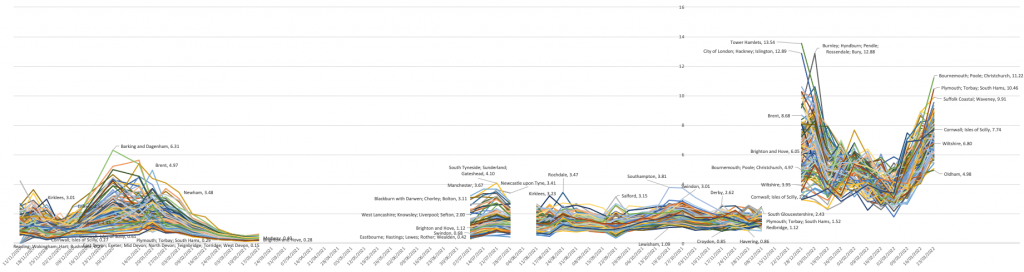
Source: ONS Coronavirus (Covid-19) Infection Survey
New waves
The story of this pandemic is usually told in terms of different variants arriving in different parts of Europe at different times, each starting off a new wave. We are beginning to realise that, even without new variants and even with vaccines, the disease will continue to circulate and new waves will form, rise and fall as immunity within local populations rises and falls, depending on how recently that population has been infected. Europe is, and will continue to be, a changing patchwork of waves varying over time and across space.
As many do not know they are infected, random testing is the only accurate way to measure the spread of the virus. Reported case numbers are an extremely poor substitute, as these depend on individuals coming forward and on a test being available. Lockdowns and other measures to reduce infection can slow the ascent of a new wave. But the longer rates in a locality have been low, the more immunity will diminish.
‘Living with’ Covid-19 will mean living with a large burden of illness for a long time. This does not take account of the long-term effects for some or the impact on health and other services disrupted by the continued contagion. ‘Endemic’ means the virus is here to stay—not trivial or minor.
Figure 3 illustrates graphically what this implies. The proportion of people in England who were infected grew rapidly in December 2021. Shortly after the Christmas holiday far more than a tenth of the population of poorer parts of London—such as Tower Hamlets, Hackney and Islington—were infected, as was also true of poorer towns in the north-west of England: Burnley, Bury and Accrington (in Hyndburn) are identified here.
Figure 3: people in 116 areas of England with Covid-19: October 2021 to March 2022 (%)
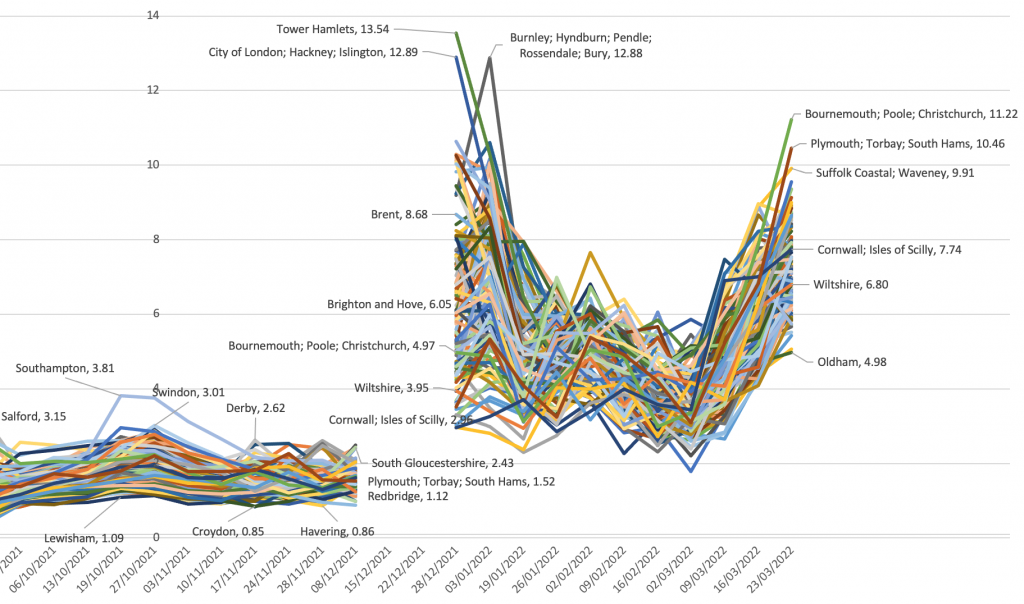
Source: ONS Coronavirus (Covid-19) Infection Survey
Rates fell in January 2022 but the fall slowed in February and they rose again in March. Now rates became highest in those areas which had had the least infection before—coastal retirement areas such as Bournemouth, Plymouth and along the Suffolk coast. It is hardly surprising, given this geography, that deaths from Covid-19 have risen again in England in April 2022.
Endless debate
There will be endless debate for years to come about the best ways to mitigate the pandemic. When cases and deaths appear to fall in particular parts of Europe, politicians may well claim credit, suggesting that the virus is ‘under control’; when these rise again, they may find some external factor to blame or prefer not to talk about it. When pressing events—such as war—intervene, public concern will, for a time, itself wane.
Mortality records will make it appear the virus is abating, because we are becoming better at treating the symptoms and preventing death and because most people will have at least some degree of immunity, making death much less likely. Yet we might come to expect a prevalence of about one in 25 in most places at most times and more than one in ten in particular places at particular times.
The virus has died down in both of the last summers. But with more contagious strains, far fewer controls and an exhausted tolerance for social distancing, that might not happen this year. It could be many years before a more-or-less-regular seasonal pattern emerges and it could be several decades before it is seen as a less serious disease because our immunity, especially among the now young, has grown.
We have no useful historical analogue. There is speculation that some previous pandemics thought to have been of influenza actually introduced a novel coronavirus (one of the current common-cold viruses). This remains however speculative and none is more recent than 120 years ago, when there were far fewer elderly and other causes of death were very much more common. Back then a Covid-19 equivalent would thus have killed or rendered seriously ill many times fewer people.
Not over
Far too many think the pandemic is over—or at least coming to an end. The prevalence rates revealed by the various surveillance surveys negate that. Close population monitoring is thus imperative.
In England infection is now highest in those areas touched least in the last two years. In more dense urban populations and among poorer areas incidence has gone up and down many times. Within my tiny home city of Oxford, at the height of wave two in January and February 2021 people living in the poorer parts of the city were eight or more times as likely to catch the virus (and die if elderly) as those in the more affluent neighbourhoods.
Yet it will get to the more affluent eventually—just less often. And we do not know what that might mean. It all depends on how quickly immunity wanes.
The affluent tend to live much longer than the poor, so there are proportionately far more better-off people today living to very old age. The virus may harm the poor more but in terms of absolute numbers more better-off homeowners have died than key workers. Men have been (and will continue to be) much more harmed than women.
Political effects
What effects all this will have politically in the medium term are hard to gauge. But life has suddenly become more dangerous for those more disposed to vote in elections who also more often vote for conservative parties. How might the elderly react to gung-ho, ‘libertarian’ political leaders of this stripe in future?
We should plan for the disruption caused by the pandemic to continue. We should not talk of when it will be over—not yet. It may end so slowly that this is only declared (and evident) many years from now.
Around the world calls for a ‘people’s vaccine’ might reduce as it becomes evident that (outside of China and North Korea) most people have now been infected at least once. Instead there might be growing recognition of the need to target vaccination on the elderly and those otherwise most at risk, especially the elderly in poorer countries.
Growing threat
Figure 4 shows who has mostly died in England and Wales, based on mention of Covid-19 on their death certificate. Although this in some ways overestimates deaths, as not all were primarily due to the virus, that is offset by lack of such mention before recognition, especially early on in 2020. The rates are also crude because they ignore the effects of ageing and migration—but again this would not alter the figure much if corrected. Most importantly, the first 12 weeks of 2022 (for which we have data) are extrapolated to give an annual estimate for this year.
Figure 4: crude annual mortality rates from the pandemic in England & Wales, 2020-2022, by age and sex
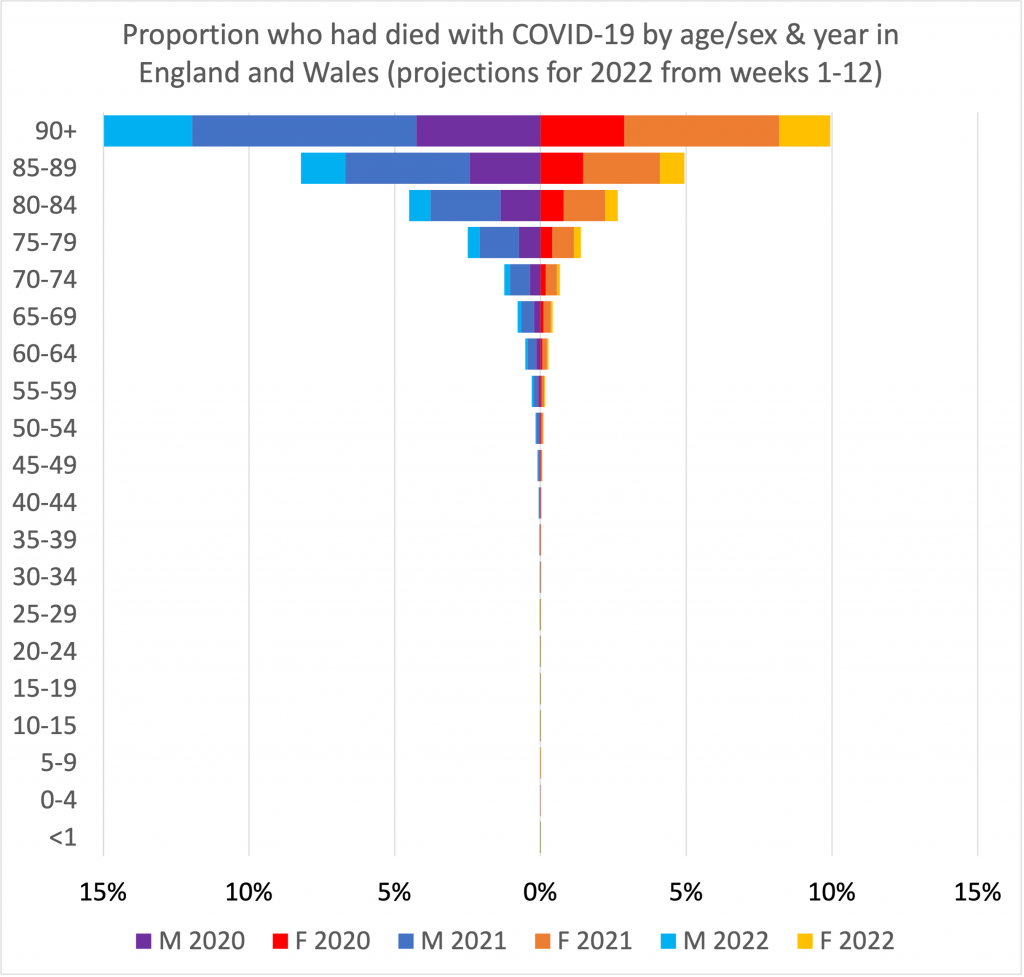
Source: ONS Coronavirus reports of deaths shown as a proportion of the mid-2019 population totals
On those assumptions, by the end of 2022 one in six (15 per cent) of all men aged 90+ in 2019 in England and Wales will have died because of the disease and one in ten (10 per cent) of all women aged 90+. Those death rates are more than 100 times as high as for those aged 40-45 and much more than 1,000 times the rates for the 25-29 age group.
Even as mortality rates for the elderly reduce in future, many of us should expect that in our old age this will be a growing threat we shall face.
…
This article was written as part of the ‘Reconstruction beyond the Pandemic’ project at the European Trade Union Institute, with an edited volume due in early 2023.
For a PDF of this article and a link to the original posting click here.