Public sector spending and Living Standards in the long run
After the Chancellor delivered his Autumn Budget of 2021, the detailed papers were released that attempted to explain and defend his decisions. They contained at least one quite new graph. Chart 1.10, shown here as Figure 1.
If you are a loyal reader of this column you may recognise the spending part of the graph from 1980 onwards. I drew it using IMF sources in the May/June issue of this magazine. Now, thanks to the work of the Treasury team, you can see both the longer term trend and the receipts (taxation) trend. When receipts are below spending the shortfall is covered by borrowing.
Figure 1: Taxation and Public Spending from 1955 to 2026
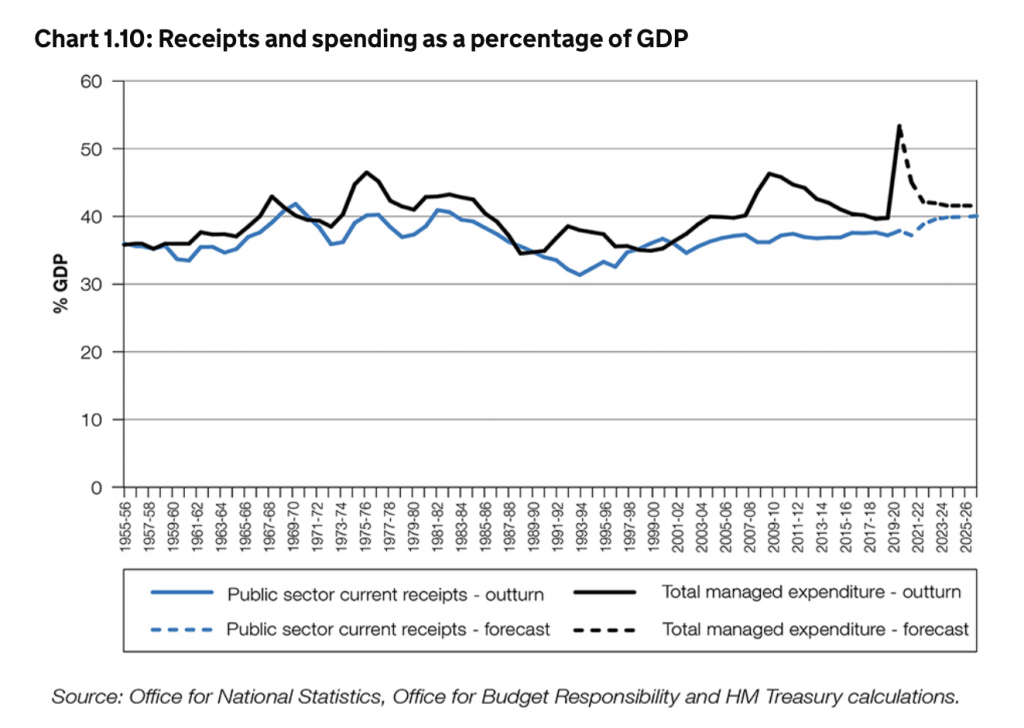
Taxation and Public Spending from 1955 to 2026
Source: https://www.gov.uk/government/publications/autumn-budget-and-spending-review-2021-documents/autumn-budget-and-spending-review-2021-html
The Treasury officials went to a lot of trouble to extend this graph back in time. The paragraph (in yet another document) describing the various sources used to construct it, and why they are comparable, runs to 225 words! The reason they went to so much trouble was to produce headlines in the Financial Times (and elsewhere) which read “Public spending and taxation both set to rise to highest levels in decades”. The publication of Chart 1.10 allowed Financial Times journalists to make the following comparisons with the 1970s and the period following World War Two:
“The yearly real-terms increase of 3.3 per cent in day-to-day spending on public services will, together with changes to in-work benefits, take total government spending from 39.8 per cent of gross domestic product before the pandemic to 41.6 per cent by 2026-27. This means public spending will be at its highest sustained level since the 1970s — before the privatisations of the Thatcher era when large parts of the economy were still nationalised. The rise in spending has been more than matched by higher taxation. The increase in corporation tax and freezing of income tax thresholds announced in March, together with the new health and social care levy, will drive the tax burden up from 33.5 per cent of GDP before the pandemic to 36.2 of GDP by 2026-27 — the highest level since the postwar period.”
So, are we back to the heady days of the 1950s, 60s and 70s when governments increasingly shifted spending from private greed to public good? Sadly, no. But to understand that you need to look closely at Chart 1.10 and also compare what it shows with another analysis carried out in the wake of the Autumn Budget, this one by the Resolution Foundation.
What Chart 1.10 shows is that the 1964-1970 government lead by Harold Wilson increased public spending sharply. What it does not show is that this was spending on housing, schools and hospitals (not nationalizations as those happened much earlier). Next, under Conservative Prime Minister Edward Heath, spending was cut back; before rising again when Harold Wilson was re-elected in 1974. Importantly, this was again public spending in Britain on public goods. Wilson had chosen not to take part in America’s war in Vietnam.
Chart 1.10 then shows huge public spending cuts throughout the 1980s and early 1990s which were accompanied by cuts in taxation (receipts) to reach a new low at the point John Major took over from Margaret Thatcher in the early 1990s. Public spending did rise a little under New Labour in the early years of this century, but part of that was funding for the Iraq war, and taxation was not increased for the wealthy by New Labour (the blue line in Figure 1 stays flat). Then, in 2008, public spending jumped hugely to bail out the banks. Unlike the spending of the 1960s and 1970s, this jump did not improve most people’s standards of living. In fact standards of living fell.
Chart 1.10 then goes on to show the austerity cuts that took place from 2010 for a whole decade, and then the rapid pandemic spending rise to pay for furlough, track-and-trace and more. Again, although partly necessary, this spending did not improve living standards. For instance, those on furlough had to live on 80% of their normal income.
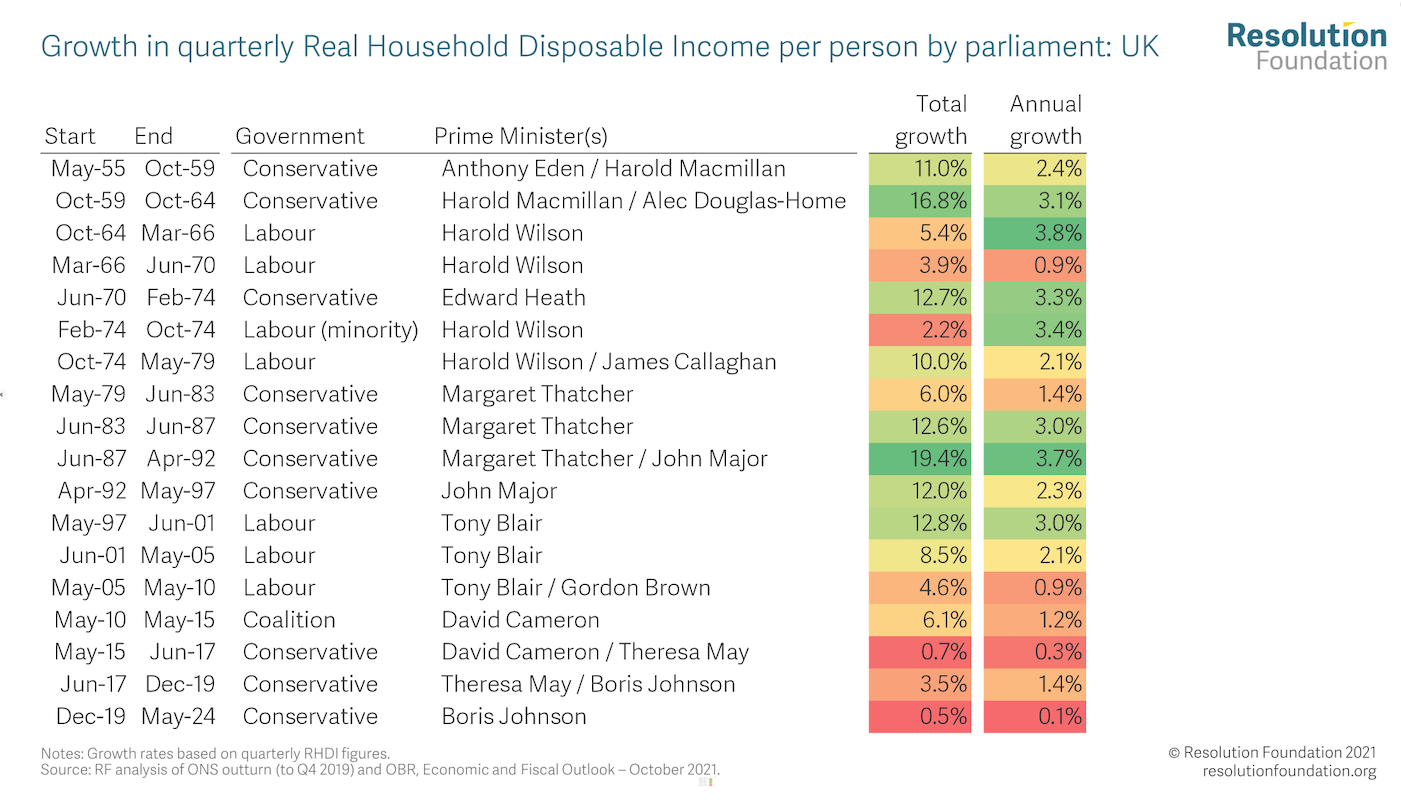
But surely, you might suggest: it’s a trade-off isn’t it? You might think that higher public spending and higher taxation to pay for such spending comes at the cost of lower real household disposable income . And it would not be surprising if you did think this, as you are constantly told this is the case. Thankfully, the Resolution Foundation produced a table after the Autumn Budget to help illustrate that this is not true. That table is shown in Figure 2 here. The key column to look at is the annual growth column as that allows each time period to be compared and can also be compared to figure 1 in this article.
Figure 2: Growth in real household disposable incomes from 1955 to 2024

Growth in real household disposable incomes from 1955 to 2024
Source: https://www.resolutionfoundation.org/publications/are-you-better-off-today/
So how could public spending for the common good rise in the 1960s and 1970s so much and annual growth in real household disposable income also rise at the very same time? Disposable income is what you have after paying your taxes and receiving benefits. Real disposable income measures that after taking into account prices rises (inflation).
The common answer is that “productivity was higher in the past”; but obviously it was not. We built cars by hand back then, not by robot. Inefficient typing pools were common (as men did not type their own letters). Manual work was most common and usually physically back-breaking. The better answer is that back in the 1960s and 1970s we squeezed the rich (see Figure 3). The average person’s disposable income might have risen as public spending also rose; but the disposable income of the very well-off fell rapidly in those decades when both public and private life became so much better for the majority.
In contrast, today Figure 1 shows that we are facing both higher taxes to come and a lowering of public spending; while Figure 2 shows living standards are expected to increase at their lowest rate ever measured in the coming years. They may even actually fall if prices rise faster than incomes. Meanwhile, the richest will be protected by government measures such as the social care cap. Figure 3 shows that back in the 1950s, 60s and 70s the richest were having to give up their mansions to pay their taxes and we had become the most equal large country in Europe by 1974. Today we are the most unequal of all, even the smaller countries, other than (occasionally) Bulgaria.
Figure 3: The fall and rise of income inequality in the UK 1910-2019
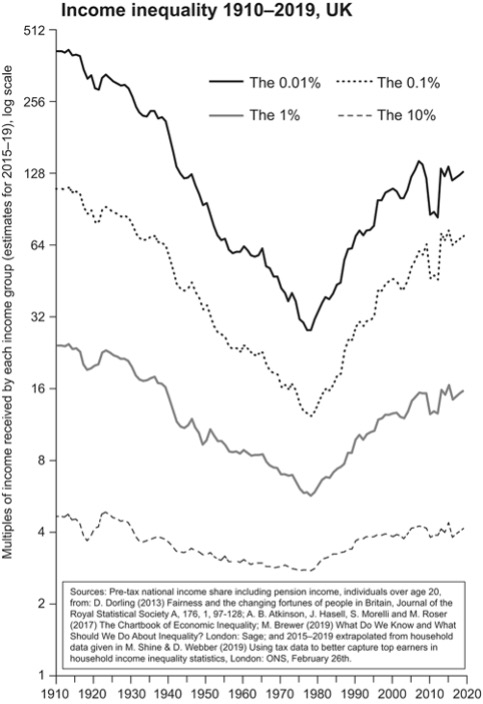
The fall and rise of income inequality in the UK 1910-2019
Source: The book, ‘Inequality and the one Percent’, Third edition, London: Verso (2019)
For a PDF of this article and link to where it was first published click here.