Slowing Down: Has this Been the Worst Pandemic in Britain in Living Memory?
If you are a little older than I am, then you may well remember worse pandemics than that of 2020. While we are still living though this one, we can mostly only speculate as to how it will finally rank; but by the late summer of 2020 mortality from the disease was very low – and we could start to compare. Because we did not lockdown in the past, because the population was younger and often smaller, we tended to not see the pandemics of the 1950s in anything like the light that we view this one. And in the 1950s an influenza pandemic was far from being a new phenomenon. To get a sense of what a new pandemic felt like in the past, this talk (in a field in Warwickshire) began with the 1854 Cholera epidemic, and London. Press play to hear the talk, or click here to learn about the socially distanced toilets.

The first 150 days – mortality in England and Wales with COVID-19 by date of occurrence.

The socially distanced (individual use) toilets at the Also Festival of 2020
When did we last know so little about a disease that we feared so much?
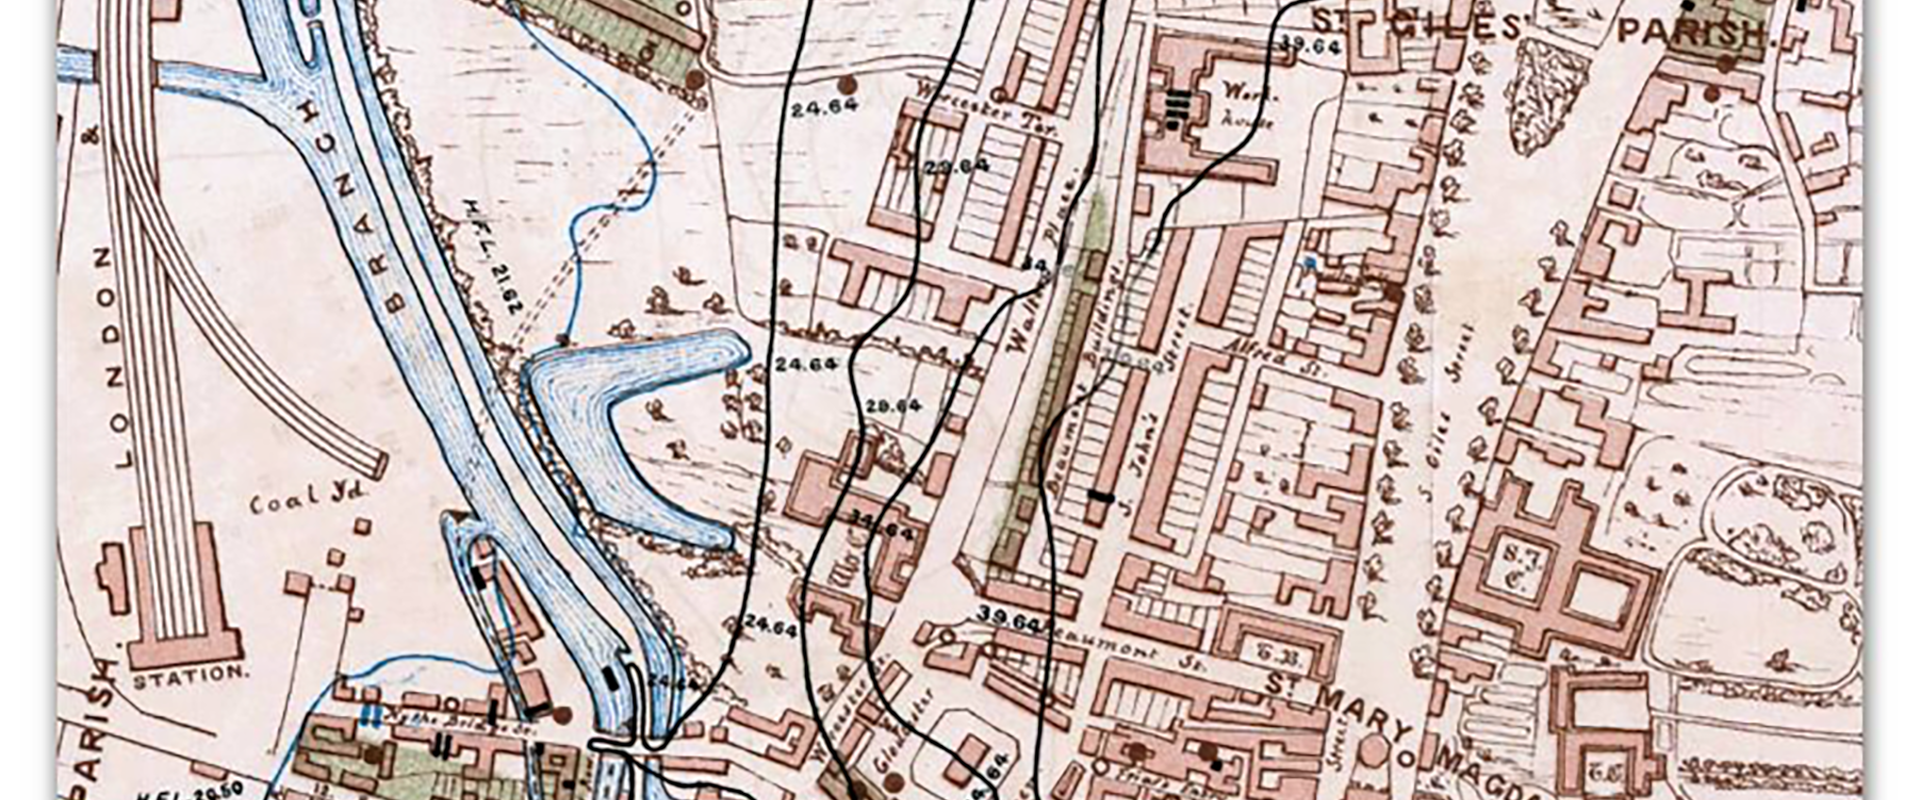
In Oxford a doctor called Henry Wentworth Acland, plotted cases of cholera on maps of that city. He noted that the number of times the sound of thunder supposedly unaccompanied by lightning, was heard in the city in the three outbreak years was 2, 8 and 4 respectively (Acland, 1856, page 62). He contrasted that with the figures for many other years. Thunder occurring without lightning was then seen as just another of many hundreds of possible causes of the cholera outbreaks.

Henry Wentword Acland’s map of Cholera in Oxford

The rapid geographical spread of COVID-19 across almost all of England and Wales

The first 155 days in England and Wales shown using two log scales.
In terms of absolute mortality rise, the increase in one year in the number of people who have died is remarkable – the third highest in 100 years – all due to the length of time of the crisis. In the 166 years since John Snow removed the pump handle in the 1854 Cholora outbreak in Soho, there have only been five occasions when mortality suddenly rose by at least an eighth in a year across England and Wales. These were in 1918 (influenza: deaths rose by 23%), 1940 (war: 16%), 1929 (cold winter: 16%), 1895 (the great freeze: 14%) and in the year to the end of June 2020 (COVID-19: 13%). The relative rise in mortality in the year to end June 2020 was greater than the Cholera years of 1846 (12%) or 1849 (10%), let alone the smaller rise in 1854 – although of course if measured by years-of-life lost, the 2020 rise will be less extreme.

Lif expectancy of men and women in England and Wales in the 12 months to the end of June each year.