The Nordic Model of Capitalism

Five countries are normally included in the Nordic grouping. At first (statistical) glance they can appear very similar. The OECD produces a long run data series of income inequality for all of its members, and for some other countries too.1 Click on https://data.oecd.org/ inequality/income-inequality.htm and you will see, at first, that the Nordic countries appear very clustered. Select the five and, in a graph that includes South Africa (the very highest line below), the Nordic countries all appear closely clustered and quite different from the greyed out mass of others. The Nordics are places where income inequalities are at a minimum, where people live lives more similar to each other as compared to people living in other affluent countries. It is almost always only affluent countries that collect data such as this consistently. It is mostly the affluent world which we talk about, when considering different models of capitalism. But there are many models of capitalism now. They are usually changing slowly (and occasionally quickly). But everywhere in the world, capitalism is changing.
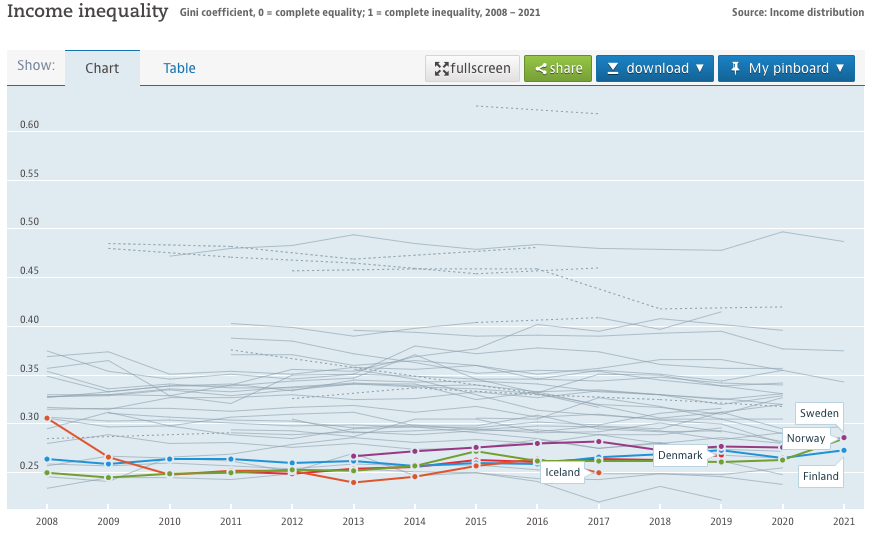
Figure 1: Income inequality in all OECD monitored countries, 2008–2021
We all see things very differently, especially the same things. One reason for this is that each of us views an object from a different standpoint. Look at just a few years and it can appear as if nothing is changing. Look at the period from 2008 to 2021 and include South Africa and it looks as if the Nordic countries have always been the most economically equitable in terms of income (as the graph in Figure 1 implies). But those 14 years are just a blink in historical time, and the few dozen countries shown in these graphs are just home to a small minority of humanity. Step back, move around, and look at the same data another way, and you see something else (Figure 2).
Figure 2 depicts the same data as included in part of Figure 1, but now just showing those countries included in the series between 2018 and 2021 and with the most recent numbers ranked. Figure 2 reveals a far less united cluster. Iceland is missing, as it has been late with reporting its data. It might be fair to say that Icelanders can be a little more laid back, although that would be to begin mix data with stereotypes. Iceland, of course, has a very small population. It is, at times and for particular data series, amazing to consider how people there manage to produce these social statistics as if they had an office containing as many statisticians as other countries do.
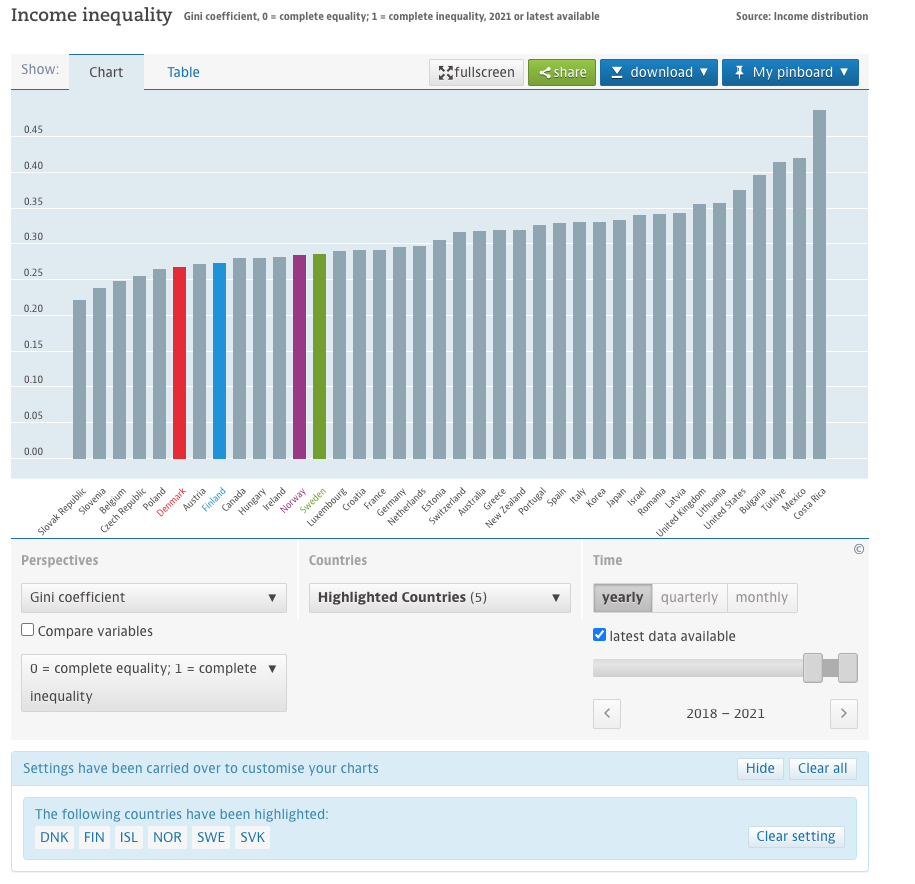
Figure 2: Income inequality in all OECD monitored countries, 2021 or latest data
Look again at Figure 2. Suddenly there is a far more obvious grouping of countries to consider. That group consists of four Eastern European ones, and Belgium, all to the far left of the graph. These five all now have a lower income inequality than the most equitable of all Nordic countries. Why are we not talking about them as a model? Is it because of a less closely shared history, or just their lack of geographical contiguity? However, that cannot be the answer as they are just as contiguous as the Nordic countries. Within the new group of five, Belgium is an offset island (like Iceland among the five Nordics) and Slovenia is a little separated, but not that far away (just as Denmark or Finland are slightly geographically separated from the other Nordics).
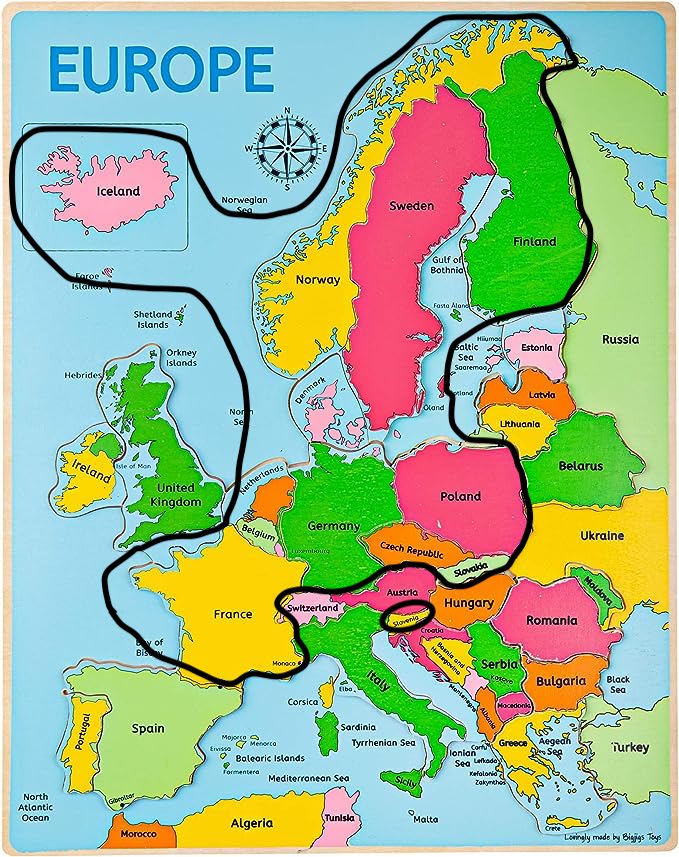
Figure 3: The 15 most equitable countries monitored by the OECD (2021 or latest data)
When discussing the Nordic model of capitalism today, it matters greatly how very similar countries like Croatia, France, Germany, Luxembourg, and The Netherlands are now to the Nordic countries in terms of income inequality. Perhaps we should not be talking about the Nordic model anymore, but today simply call this the ‘Northern European’ model? The Nordic five are increasingly just a typical part of a Northern European fifteen, including the five slightly more and five slightly less equitable countries. In terms of population this is a far larger grouping. Think of it as a geographical ‘X’. This is ‘advanced’ Northern Europe, or ‘Nordic +’ if you are sentimental about that name – see the map in Figure 3.
Nordic+ is bordered by some extremely unequal states. To the west is the UK, and Russia neighbours this block to the east: two states which are remarkably similar in terms of inequality and in how badly the poor now fair in both. Both also have outsized capital cities. To the southeast is Bulgaria, the most unequal country in Europe, and next to it is Turkey, which is even more unequal, though only partly in Europe. Turkey also has an outsized largest city. Surrounding the Nordic+ grouping are Istanbul, London and Moscow, all relic capitals of past empires: the Ottoman, British, and Soviet empires that all existed under capitalism. The fact that all are now dead empires shows just how much changes under capitalism and within the era we think of as capitalist. Other neighbouring countries with less recent historical hang-ups of imperial domination are much closer to securing entry to Nordic+: Estonia, Italy, Portugal, Spain and Switzerland being among the most notable. These five are not far off from joining Nordic+ within a few years if they can only become slightly more equitable places to live and work and play. Adding them would make the grouping a club of twenty at that point, one that might then just best be termed: ‘almost all of Europe’.
But why stop at Europe? Let’s look a little further out, again with the same data. This data set is still very geographically limited, but Canada is now as equitable as Sweden in terms of income, so maybe the Nordic+ should have at least 21 members? But then we would have to start to consider countries like Japan, which by some measures of income inequality, but not all, are even more equitable than Canada and Sweden (Ballas et al., 2016). The problem with defining a Nordic model is that it can only be a model that applies for a short time. It is today a model that suggests that the Nordic countries are more similar than they are, and more different to other countries than they actually are.
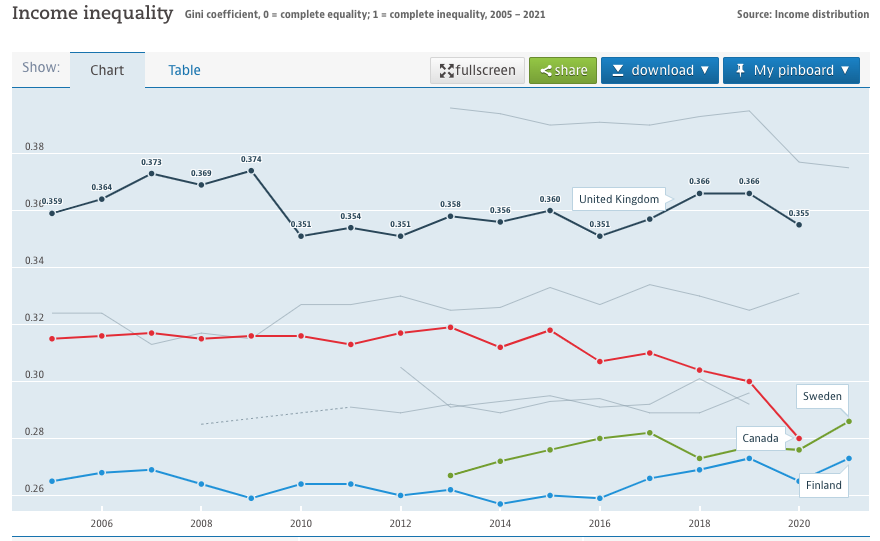
Figure 4: Income inequality in four OECD monitored countries, 2005-2021
In Figure 4 the UK is also highlighted to show how very different it is – but in 2012 it was more similar to Canada than Canada was, back then, to Sweden. Remarkable things have been happening in Canada recently (Statistics Canada, 2022). Above the UK is the United States, just below it is Italy (the second most unequal large country in Europe). Germany and France are the two interlocking lines in Figure 4, the two between Canada and Sweden.
Capitalism changes. Capitalism is always changing. Capitalism, at its most basic, is simply a change. It is the change from some fairly stable set of social systems, ones that dominated human life across the planet for much longer than this change has been in play, to what some of us hope will be another set of fairly stable social systems, or perhaps just one system. There is nothing stable about capitalism. We only think of it as such because we live such short lives. If we lived for 800 years we would see capitalism as a short mid-life crisis in the world systems during our lives. But that is very difficult to imagine, so next, to try to illustrate just how quickly things change, Figure 5 presents one final graph from exactly the same source, created just by clicking on a couple of different options on the OECD web tool.
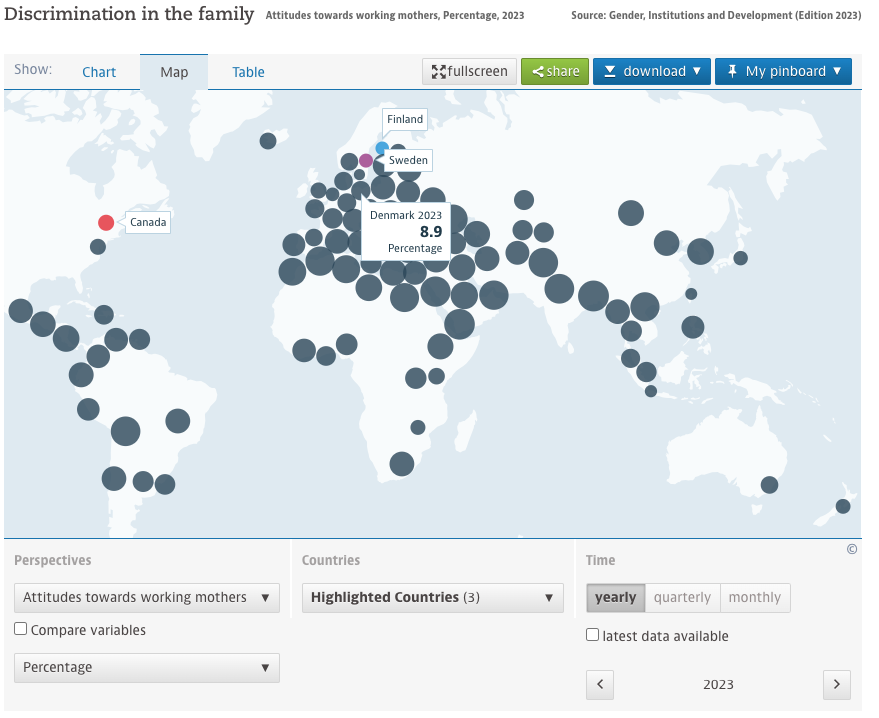
Figure 5: The proportion of people who believe children suffer when mothers work, 2023
Each circle in Figure 5 is a country, with the circle drawn in proportion to the share of all adults who agree, when surveyed, with the statement ‘when a mother works for pay, the children suffer’. In the Americas that proportion is lowest in the United States and Canada (about 20%). In Europe it is lowest in Denmark, at 8.9% (the label is not exactly aligned due to the workings of the OECD software, but Denmark is the smallest dot in Figure 5).
When looking at Figure 5 we could consider the extent to which whether a child suffers depends on what else is available for the child, what men do, and how society in general is organised – and how that also is changing. A child simply at home with their mother can be a very bored child (perhaps with a very lonely and bored mother). The proportion is also low in Indonesia, Japan, New Zealand, Tapia and Zimbabwe (17.8%). It is higher in Iceland and Norway than Zimbabwe. Perhaps we should add these five countries to now form Nordic++?
Not many years ago (in 2008) one prominent educational researcher suggested that the OECD was a ‘… crude, lumbering think-tank of the most wealthy nations, bulldozing over human dignity without pause for thought. Its tracks, crushed into the barren dereliction left behind, spell ‘global free market’’ (Stephen Ball quoted in Dorling, 2015). Interestingly, though, those countries doing best in the free market included the Nordic ones (Figure 6).
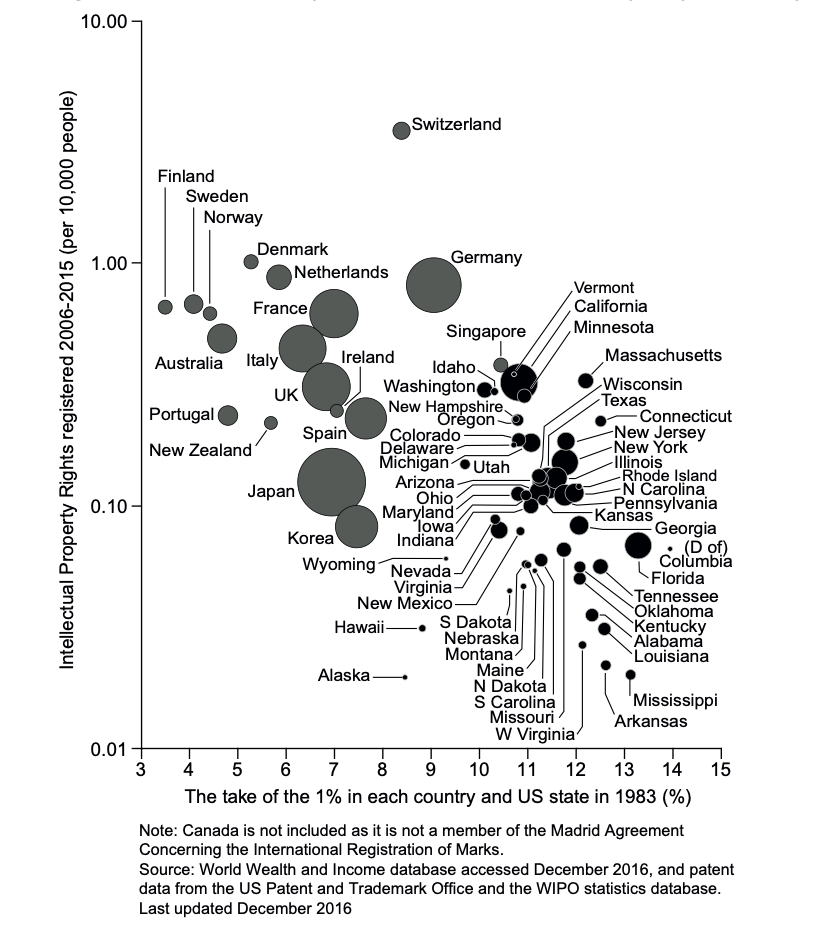
Figure 6: Patents claimed per head 2006–2015, verses inequality in 1983, population by area
Another writer, writing more recently, explained: ‘People talk about capitalism as if it were just one thing, but the truth is that we live in a global system of capitalisms plural, with a chunk of ideology in common but considerable differences in local emphasis.’ (John Lanchester, quoted in Dorling, 2023). We are currently in a period where we are better than we used to be at noticing the differences. This may be because those differences between the United States and most of Europe have grown in recent decades, and because most of us who are writing about this are European; and everyone I quote here is male and English. We notice what happens within Europe more, we tend to be myopic. But there are also growing differences between what is happening in the separate states of the United States (see Figure 6 for just one example from many). Everywhere, capitalism is on a different trajectory. It is a change that moves at different speeds at different times in different places – like a series of rocks falling, tumbling or just slowly sliding, down a mountainside, before they all settle at the bottom.
This volume of the journal that short paper appears in mostly concerns the differences between the five Nordic countries. They are very interesting differences, and they matter. Each country varies so much from the rest that it sometimes feels wrong to group them. However, generalisations are possible. As a rule of thumb, those nearest to the UK tend to be home to folk who are a little more selfish, those further away are more collective and generous in their outlook, but all are so very different to the United States that when types of capitalism came to be defined, they were all lumped together. Just as interesting is how many other countries in the world are now becoming more Nordic in so many ways, or are even more Nordic than some of the Nordic countries!
The Nordic countries are often thought to be institutionally distinct. It is hard to find a series of measures of the nature of institutions to test this theory. Certainly, trust in institutions is higher in Nordic countries, but that might well have simply been a function of those countries being more equitable and happier places earlier than others. It is not necessarily that the ‘Nordic way’ is becoming less distinct, it is that more places in the world are becoming more Nordic. The Nordic way was also often misunderstood. Figure 6 shows how levels of innovation were always very high in those Nordic countries for which there was data. The same is true of other measures, such as numbers of academic papers written per capita, and technological innovations and inventions. The Nordic countries were and are some of the most entrepreneurial. In contrast, it has been the case for a very long time that much of the United States is not just a place of very poor health, low educational achievements, lack of decent housing and high imprisonment and crime rates, but also a place of very low imagination and poor entrepreneurial economic achievement. Figure 6 uses a log scale so that the worse performing states of the United States can fit on the graph.
Capitalism, the explosion of production and human population made possible by disrupting every stable social system on the planet – and allowing a few people to gather wealth in a way that had almost never been permitted before – is ending as a change. Putative attempts to begin capitalism in China in much earlier centuries were halted because of concerns about what might be unleashed. Today we live in a world where it is not just a few rulers seeing capitalism as being a dangerous change, but billions of people trying to end its worse effects. The Nordic model is a part of that – high innovation but with some of the lowest rates of exploitation and immiseration ever recorded in human history. It is something which began a few decades ago in a remote part of Europe. At the same time as the Nordic model began, other developments around the world of even greater importance were taking place. These ranged from revolution in China through to repeated failed attempts at greater emancipation in South America. The Nordic model is a blip in the history of a great change.
That change is capitalism, which itself is a blip in the history of a species. It is just that from where we are looking, it feels as if time is passing very slowly, and as if the world is a very big place.
References
Ballas, D., Dorling, D., Nakaya, T., Tunstall, H., Hanaoka, K., & Hanibuchi, T. (2016). Happiness, social cohesion and income inequalities in Britain and Japan. In T. Tachibanaki (Ed.), Advances in happiness research: A comparative perspective (pp. 119–138). Springer. https://link.springer.com/ book/10.1007/978-4-431-55753-1
Dorling, D. (2015). Injustice. Why social inequality still persists. Policy Press.
Dorling, D. (2023). Shattered nation. Inequality and the geography of a failing state. Verso Books.
Statistics Canada. (2022). Eh sayers podcast: Why haven’t we ended poverty yet?. Statistics Canada YouTube Channel, https://www.youtube.com/watch?v=HPfqyYncfzQ
For a PDF of this article and place or original publication click here