The City of Oxford and the Pandemic of 2020/21
Within the boundaries of the city of Oxford, for all of 2020, only 95 deaths were registered with COVID-19 being mentioned on the death certificate. It is possible that very early on in the pandemic a few Oxford residents will have died because of the disease, but that was not recognised at the time. However, a possibly similar and also small number of people probably did not die mainly due to the disease despite having it, and it being mentioned on their death certificate. These two sources of error in the official statistics tend to cancel each other out nationally.
Of the 95 residents of the city of Oxford who died directly because of the pandemic in 2020, 46 died in hospital, 30 in care homes, 10 at home and 3 in another communal establishment. In that same year 1,005 people died in total in the city; so 90.5% of the people who died in Oxford city in 2020 did not die because of the pandemic; but from another cause of death. That proportion, of just over nine out of ten deaths in Oxford, compares to 86.8% for England and Wales as a whole, so Oxford experienced a below average pandemic mortality rate in 2020, despite being so close to the epicentre of the pandemic in the UK, and the place which saw the worse rates of all: London. However, the second wave was worse for Oxford than the first.
For residents of the city of Oxford, more died directly due to the pandemic in the first 10 weeks of 2021 than in all of 2020. The number dying then was 102 people (in total) in those first ten weeks of 2021: 65 in hospital, 28 in care homes and 9 at home. As I write (on the last day of March 2021) that number has dropped to zero in week 11. In those first ten weeks of 2021 38.8% of all deaths of Oxford city residents involved COVID-19; this was now above the national proportion at that time which was 34.6%. Oxford suffered similarly to England and Wales overall; but only because wave 2 was worse than wave 1for the city. Wave 2 ended far more abruptly than wave 1, due to vaccination.
If you had been working in a hospital in the city you may think these numbers look low; that was because more died within the city of Oxford, in its hospitals, who were resident elsewhere in the county of Oxfordshire or even further away – so their deaths are not recorded within the statistics for the city. And it may also be because so many people have been ill for each person who has died, some extremely ill. It is data on where most people within Oxford were ill at the height of wave 2 in January 2021 that tells us who was most affected in the city. At that point in time the cases, and hence the deaths, were hugely concentrated among people normally resident in the poorer parts of the city.
The UK Government dashboard produced a map of cases of the disease per 100,000 people living in each area. An inset of that map is shown here, a snapshot taken in January 2021 at the height of wave 2. At that time, three areas of Oxford reported known minimal rates of over 800 per 100,000. The real rates of infection will have been at least three or four times greater than that. The actual rates of disease will have been higher than those reported because only a minority of people ever come forward to be tested – those with bad symptoms or additional worries.

The proportion of people tested positive for COVID19 in each neighbourhood of Oxford in January 2021
As the map shows the areas with the highest number of cases were centred on Barton, Donnington, and a large area stretching from Rose Hill to Greater Leys – all containing parts of the city which have been the poorest in recent decades, parts where overcrowding is highest and where most people have no choice but to work, and work at jobs which cannot be done at home (there is very little unemployment in Oxford). In contrast, in the wealthier enclaves of the city between Jericho and Summertown between 4 and 10+ times fewer people had the disease at this time; and here it was generally far easier to work from home, if not mandated to work at home by many of these peoples’ employers.

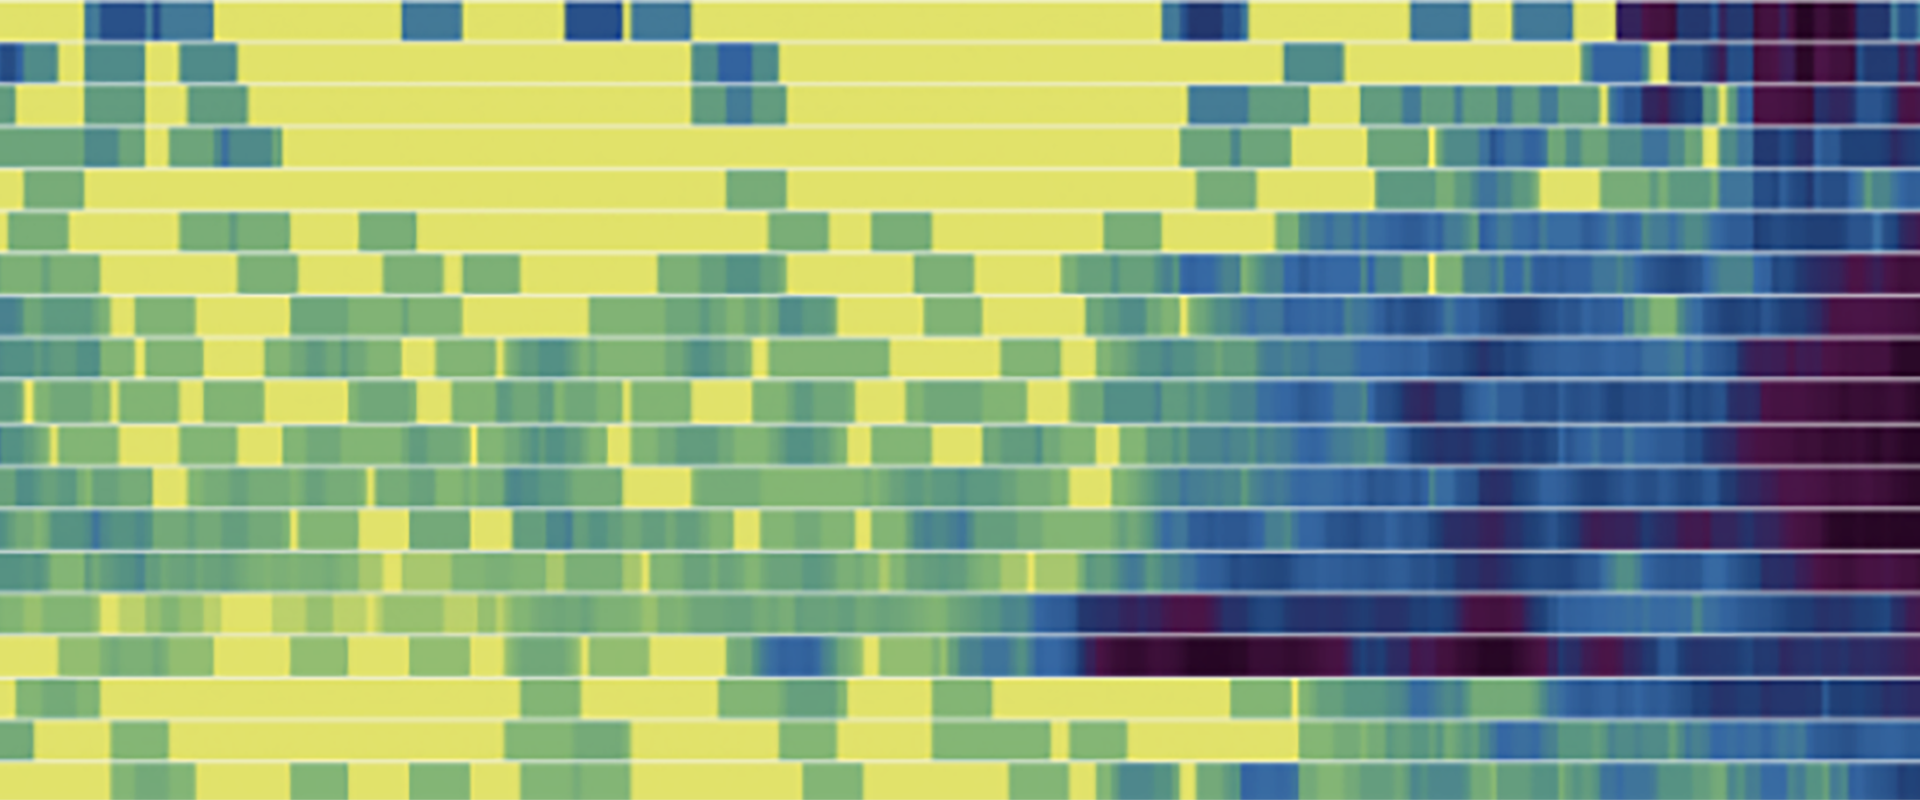
Oxford City: people testing positive for COVID19 by age and week 2020/21
One question people may ask is whether there is any evidence that having a large group of students in residence at the two universities in Oxford had an influence. The heat diagrams shown below are probably the best evidence we have to suggest they did not. So although there was a rise in cases among the student-aged population in October and November 2020 it did not spread into older groups then. Similarly in Cambridge; but the pattern for Milton Keynes, an urban centre of similar size and distance from London but without a large student population, is very different.

Cambridge City: people testing positive for COVID19 by age and week 2020/21
In Milton Keynes rates rose slowly in late September and October among young adults and that increase slowly spread to older and older groups in the population. When the new “Kent” variant arrived in December 2020, there was a sudden and accelerated increase. Much the same happened in Oxford and Cambridge at the very same time, but earlier – in late November and early December there were very low cases in the two ancient university cities. Whatever risk students returning to the city in October may have brought with them had largely dissipated.

Milton Keynes: people testing positive for COVID19 by age and week 2020/21
It looks as if there was very little connection between infections among students, which rose in the autumn and then fell in early winter, and cases among locals – which rose later. For once, the invisible but very real wall between town and gown may have been beneficial. It is a form of quarantine. If we were in any way a normal university town where more students lived at home with their parents, and far more lived out in the community, then the city of Oxford may have suffered a higher mortality rate. This is not a general argument for the benefits of cloistered, anachronistic and bizarre traditions and social divisions – merely an observation that very occasionally, as in autumn 2020, it is actually possible to point out a positive aspect to the caste/class system of this city.
For a PDF of this article and a link to where it was first published click here.