Coronavirus: how the current number of people dying in the UK compares to the past decade
by Danny Dorling, University of Oxford
The speed of the global spread of coronavirus is staggering.
On March 5, Chris Whitty, the UK’s chief medical adviser, announced the death, in Berkshire, of the first UK patient to have tested positive for COVID-19, the disease associated with the new coronavirus. That patient had contracted the virus within the UK.
Exactly eight weeks earlier, on January 9, in the Chinese city of Wuhan, the first such death worldwide had occurred. At the time it was reported that there was no evidence the virus could spread between humans. That was quickly proved wrong. The virus spread around the world and the rise in deaths is now slowest in those countries it reached first.
In England and Wales, the very latest data has just been published on the number of all deaths registered in the week ending March 13 – which was 11,019 people. This was some 186 fewer than in that same week over the course of the last five years.
It’s worth looking in detail at the period just before the pandemic reached the UK to understand what huge variations in mortality occurred recently before anyone died due to COVID-19. That’s because it’s useful to know how bad the situation already was in late January, February and early March before the crisis fully hit as it is expected to – and how often the numbers dying at this time of year have risen above what the NHS and adult social services have (and have not) been able to cope with in very recent years.
Fewer deaths than average
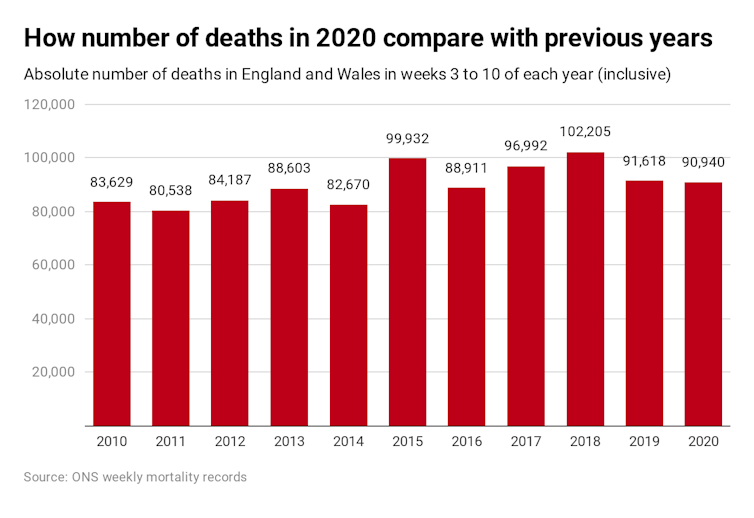
In the 56 days from January 11 to March 6, the total number of people who died in England and Wales was recorded as being 90,940, only one of whom was known to have tested positive for COVID-19. Others who died may possibly have had the disease, but not been tested for it. However, it’s unlikely that the virus was widespread in England and Wales in the first few months of 2020. That’s because the 90,940 deaths was 5,023 people lower than the average in the same eight-week period over the previous five years, which was 95,963.
One obvious reason why fewer people died in early 2020 was because the previous five years had been extraordinarily bad, as the graph below (at the bottom of this page) shows by comparing the absolute numbers of deaths in these same 56 days in each of the last 11 years.
In England and Wales the most recent year of low mortality was 2014, in which 82,670 people died and life expectancy across the whole UK temporarily reached its highest ever level for both men and women. However, 2014 was not that unusual until recently. For the five years before that, between 2009 and 2013, 85,023 people died on average in England and Wales in these same eight winter weeks. Part of the reason why there may be fewer recorded deaths during these eight weeks in 2016, 2019 and 2020 than in 2015 and 2018 is because more people died when social services and the NHS were particularly overwhelmed, leaving fewer frail people alive and at risk the next year.
The huge rises in mortality across the UK since 2010 are now widely accepted to have been linked to austerity cutbacks on services, especially social services. The rise in deaths was not due to ageing as there were very few births in the 1930s when the population currently aged 81 to 90 were born.
Mitigation matters
So how well is the UK in general geared up to deal with the spread of the virus?
It has been reported that, compared to Germany, the UK has five times fewer ventilators per person at risk. Since austerity deepened the UK has been spending roughly a million euros (£925,000) less a week on its health services compared to Germany.
There has been little planning and a great deal of denial. Reports have suggested it was only on March 11 that the full scale of the challenge facing the NHS fully dawned on the government’s scientific advisers.
What we know at the moment is that the virus is especially deadly among the elderly. The Cambridge statistician David Spiegelhalter has implied that one way of viewing your chance of dying following contracting COVID-19 is that it’s like having the mortality chance of somebody eight years older than you are. For a 20-year-old, having the mortality chances of a 28-year-old is nothing to worry about; but for an 82-year-old having the chances of a 90-year-old is.
Researchers at University College London have produced estimates for the likely number of UK deaths which vary from between 13,791 and 1,110,332 depending on whether mitigation is successful and if the relative risk turns out to be lower than expected, compared to a “do nothing/high-risk” scenario.
Mortality rates in the spotlight
The number of people who die in each country in Europe may well depend not only on government action, but also on the number of already very elderly and frail. Another fact may be whether the usual living conditions mean that old and young tend to live together – something which varies markedly across Europe. This may have been one reason why mortality rates rose faster in Italy.
As cases in China shrank and those in Europe grew, the world map appeared split when shaped by deaths due to COVID-19 as counted up to March 23.
According to the Centre for Evidence-Based Medicine at the University of Oxford, the current mortality rates reported across Europe for people tested and found to have the disease vary from 9.3% per infected person in Italy, 6.6% in Spain, 4% in China and 4.9% in the UK, to as low as 0.4% in Germany and Austria, and 0.3% in Norway.
This is why at 8.30pm on March 23 the UK was put into lockdown. Such action was sensible given how little we currently know. We will know much more very soon.
However, the Oxford estimates also suggest that of those actually infected, as compared to those known to be infected following testing, the actual global mortality rate may be as low as 0.2% – or less. This is what we should hope for – while preparing for worse.![]()
Danny Dorling, Halford Mackinder Professor of Geography, University of Oxford
This article is republished from The Conversation under a Creative Commons license. Read the original article.
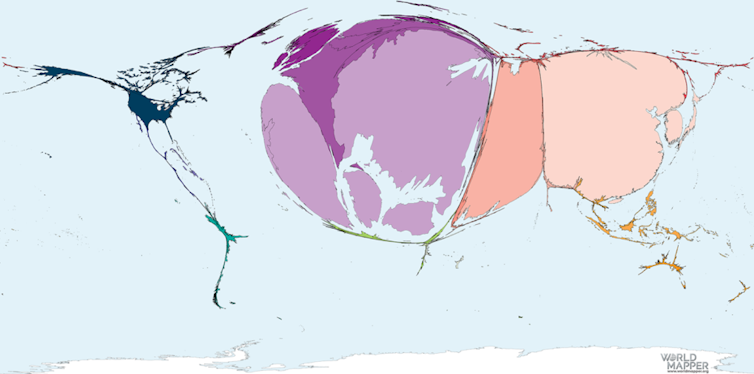
By Worldmapper, CC BY-SA
… and get a PDF here.