Annual Report of the Chief Medical Officer, 2018, Chapter 6: Demography
The UK has fallen down the rankings significantly … for life expectancy at birth. In the most recent two years ONS has reported statistically significant increases in infant mortality across England for all infants.
An edited extract of the start of Chapter 6 of the Annual Report of the Chief Medical Officer: Better Health Within Reach, London: Department of Health and Social Care, published on December 21st 2018:
Health 2040 – Better Health Within Reach
“Every part of the health system has a role to play in
creating a healthier and fairer future. The fortunate
truth is that we already know how to make fantastic
improvements and prepare for better health that is
‘within our reach’.”
Prof Sally Davies, Chief Medical Officer, England
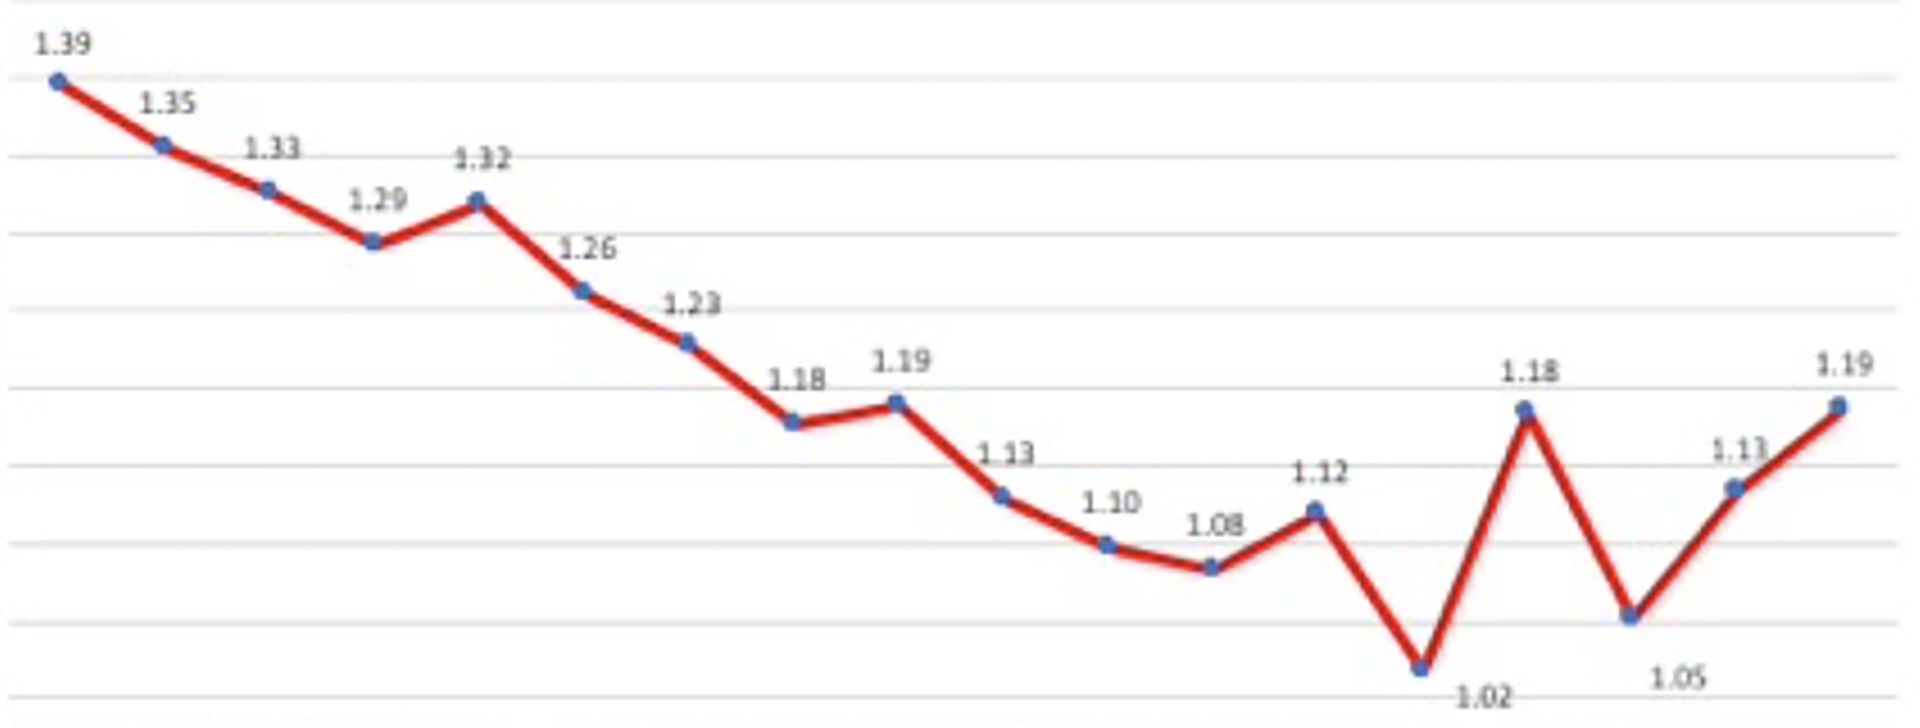
Figure 6.1 Age-sex standardised mortality rates for England Quarter 1 2001-2018

Note: shows proportion of people dying each year in England at quarter 1 rates
Source ONS data, 2018
1.1 Life expectancy
Period life expectancy, derived from age-specific death rates in a given year, is widely used as an indicator of how well a country is performing in improving the health of its people. It has been improving steadily, albeit with some small fluctuations, for decades in high income countries. However, in recent years, these improvements have stalled in England and Wales and, in some older age groups and in some places, it is even declining. There are similar concerns about Scotland and Northern Ireland, but these have been studied less intensively. When the rate of improvement in life expectancy has slowed, stopped, or reversed elsewhere in the past, for example in Eastern Europe in the 1980s, after data artefacts, epidemics, wars, major natural disaster, or mass migration have been excluded, the outcome has often pointed to substantial societal problems.
Figure 6.1 shows the age-sex standardised mortality rate for England from 2001 to 2018, as a percentage. Figure 6.2 shows the resulting trends in life expectancy at birth as reported by the ONS from 1840 to 2016.
Figure 6.2 Life expectancy at birth in England and Wales, 1840-2016

Life expectancy at birth in England and Wales, 1840-2016
Source ONS data, 2018
After 2010 there is a clear slowdown in the rate of improvement of life expectancy, and increase in age-standardised mortality. The reasons have been the subject of much speculation. Proposed explanations include cohort effects, reflecting influences on health and mortality long ago, or contemporary phenomena such as the lethality of seasonal influenza could play a role. However, several studies have also suggested that the austerity measures, introduced by the coalition government that was elected in that year, could also be playing a role, given the sections of the population most affected and the timing of policy changes, as the long term year on year increases in spending on health and social care slowed dramatically.
This last explanation finds support in an examination of changes in life expectancy at different ages. Consistent with the general trend, life expectancy at older ages had been rising steadily, if anything with a slight acceleration in the period immediately prior to 2011. Table 6.1 [see published chapter] presents the change between consecutive three-year averages (to smooth annual fluctuations). A very similar trend is seen for men and women, and for life expectancy as measured from either age 65, age 75 or age 85. In every case, the size of improvements declined markedly after ‘2008-2010’ and ‘2009-2011’. What is especially worrying is how the oldest groups have experienced actual declines in the most recent period. The worsening of life expectancy for women over 85 years was first raised as an issue of immediate concern over three years ago, yet it received little attention then and little since, despite becoming much worse year on year.
Both a PDF version of the full chapter and the link to the Department of Health and Social Care full report can be found here.