Very Long-Term International Housing Price Trends
Against the backdrop of recent global house price inflation, this paper addresses the question commonly asked about asset price booms and crises: ‘Is this time different?’ To identify the distinctive characteristics of today’s house price booms, we examined the long-term history of housing prices in five capital cities: Amsterdam, London, Beijing, Seoul, and Tokyo. Specifically, we employed house price, annual income, and average expenditure data to estimate real house price indices from the 1620s to the 2020s. The findings indicate that recent house price inflation is distinct not in severity but in synchronicity. The amplitude of house price booms and busts has remained consistent. However, house price cycles that historically moved independently have in recent decades more often been showing similar variations both regionally and internationally in recent decades. Now, prices tend to rise and fall together, but do not rise above the historical peaks of the past.
1. Introduction
Although housing boom and bust cycles have repeated throughout history (Bordo and Landon-Lane 2014), the continuing global house price inflation of the last decade has raised concerns over housing affordability and widening wealth inequality (Piketty 2017). International organisations, including the UN, recently highlighted the severity of the crisis and urged re-thinking solutions (United Nations 2023). The bourgeoning discourse on the housing crisis recalls the typical question regarding all price booms and financial crises: ‘Is this time different?’
We try to answer the question of whether today is different by tracing the long-term history of house prices in five European and Asian cities: London, Amsterdam, Beijing, Seoul, and Tokyo. Specifically, we compare historical and modern real house price trends, calculated using house price and income data from different sources, to identify the distinct features of current house price booms.
2. Data and methodology
We collected historical and modern house price data for five cities from various sources and estimated real house price indices to compare them over time and between places. Here, the term ‘real’ means house prices compared to contemporary annual incomes or average expenditures. The minimum value of each data series was used as the base of the real house index and set as 100. The cities we selected were chosen because they have the most extensive and reliable time series data. Table 1 provides the details on data sources and estimation methodologies.
Table 1 Data sources and processing {see published paper – link at the bottom of this page}
3. Results
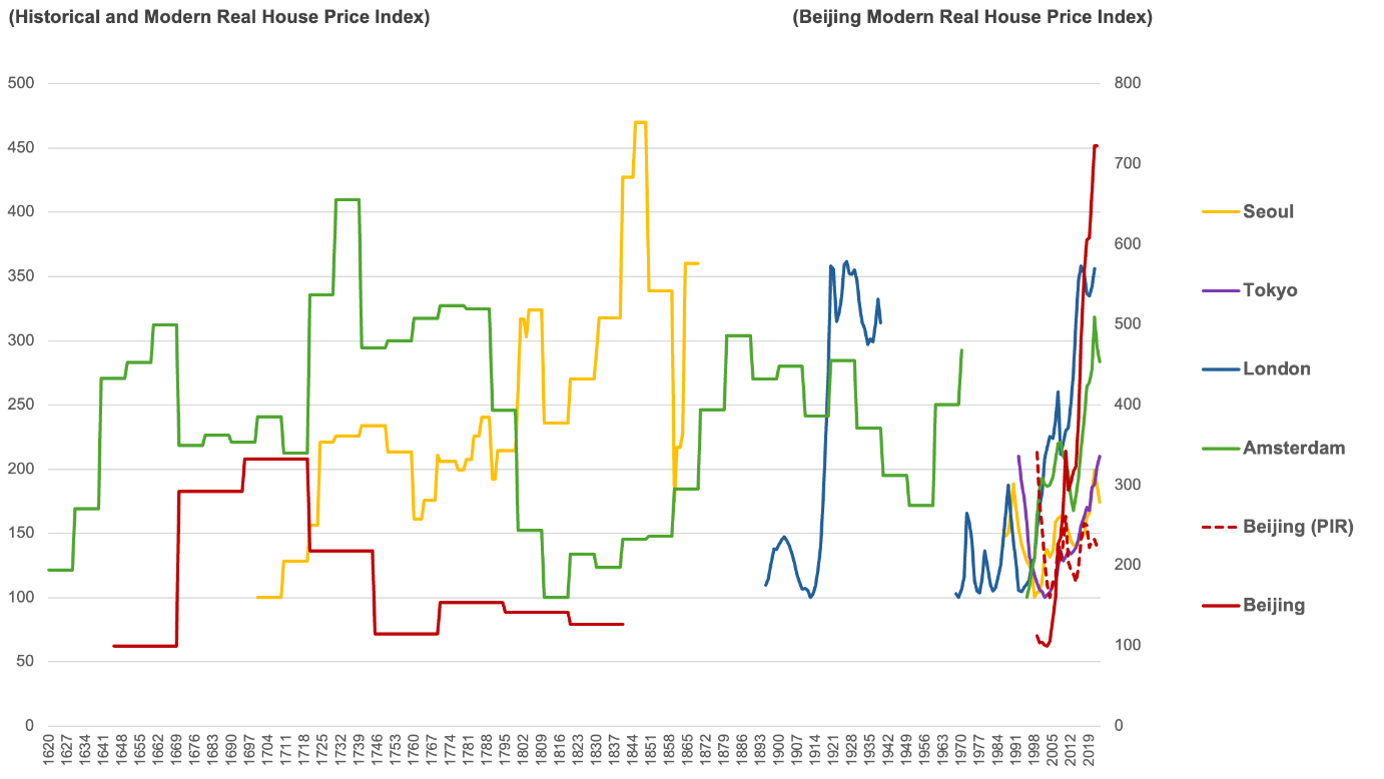
Figure 1 outlines the five cities’ historical and modern real house price indices. House price boom and bust cycles have repeated several times in the selected cities, while the peak of each cycle does not exceed 500 (five times the lowest ever recorded real prices), except in modern Beijing, where the inflation-adjusted index almost reaches 730. However, Beijing’s Price-to-Income Ratio (PIR) does not exceed 250, so its range is similar to other house price cycles. It is also worth noting that historical house price cycles have moved independently, whereas modern cycles have become much more synced with each other and indicate the boom phase that has recently caused consternation. Furthermore, house prices in Asian cities plunged in the late 20th century when the Asian Financial Crisis (AFC) broke out and Japan’s bubble economy collapsed. Conversely, European cities experienced house price inflation during the same period. Thus, the current global synchronisation is unusual. Given this coincidence, this time might be different.
… paper continues….
For A PDF of the full paper and place of original publication, click here.
Figure 1: