Finntopia Figures & Tables
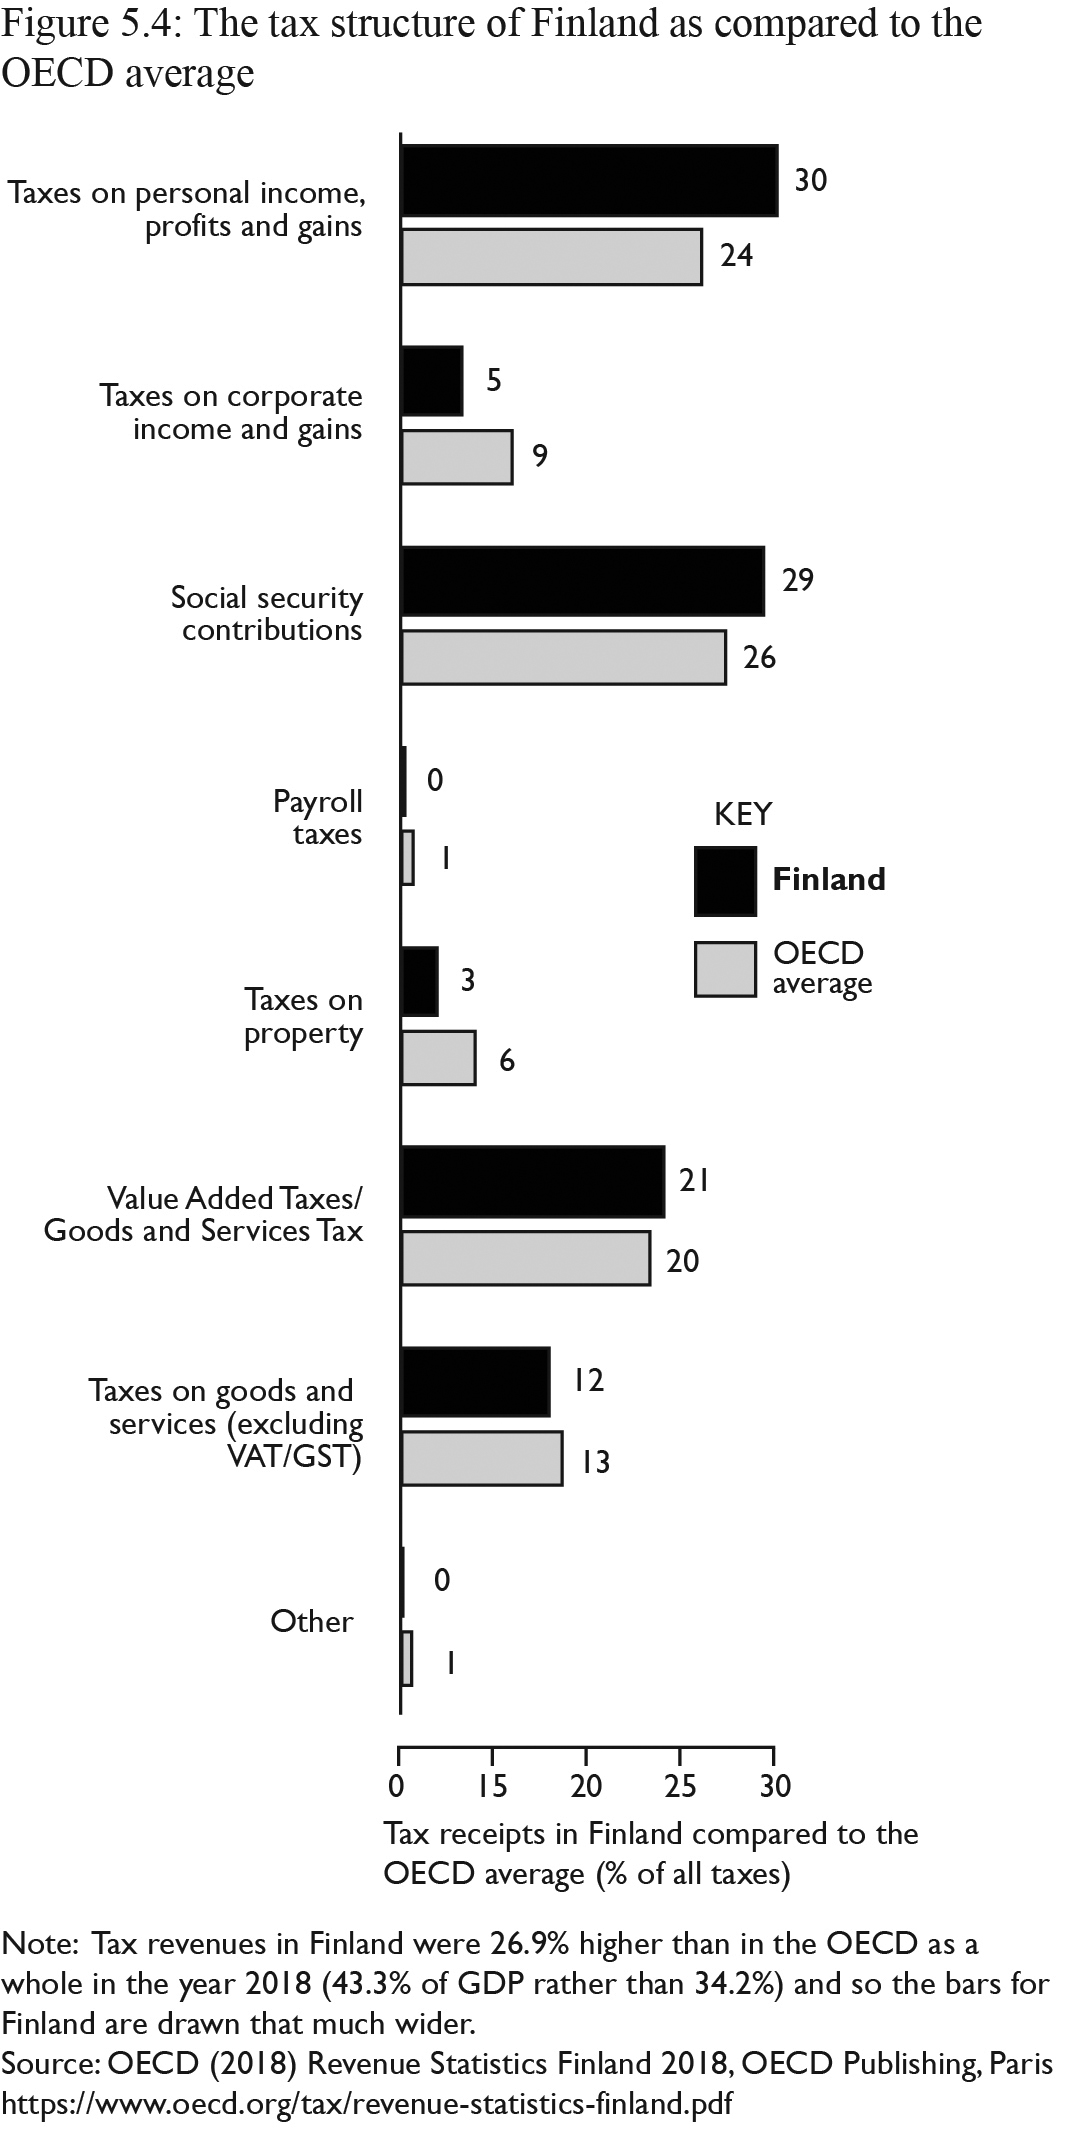
Figure 5.4: Note: tax revenues in Finland were 26.9% higher than in the OECD as a whole in the year 2018 (43.3% of GDP rather than 34.2%) and so the bars for Finland are drawn that much wider. Source: OECD (2018) Revenue Statistics Finland 2018 , OECD Publishing, Paris, https://www.oecd.org/tax/revenue-statistics-finland.pdf