Finntopia Figures & Tables
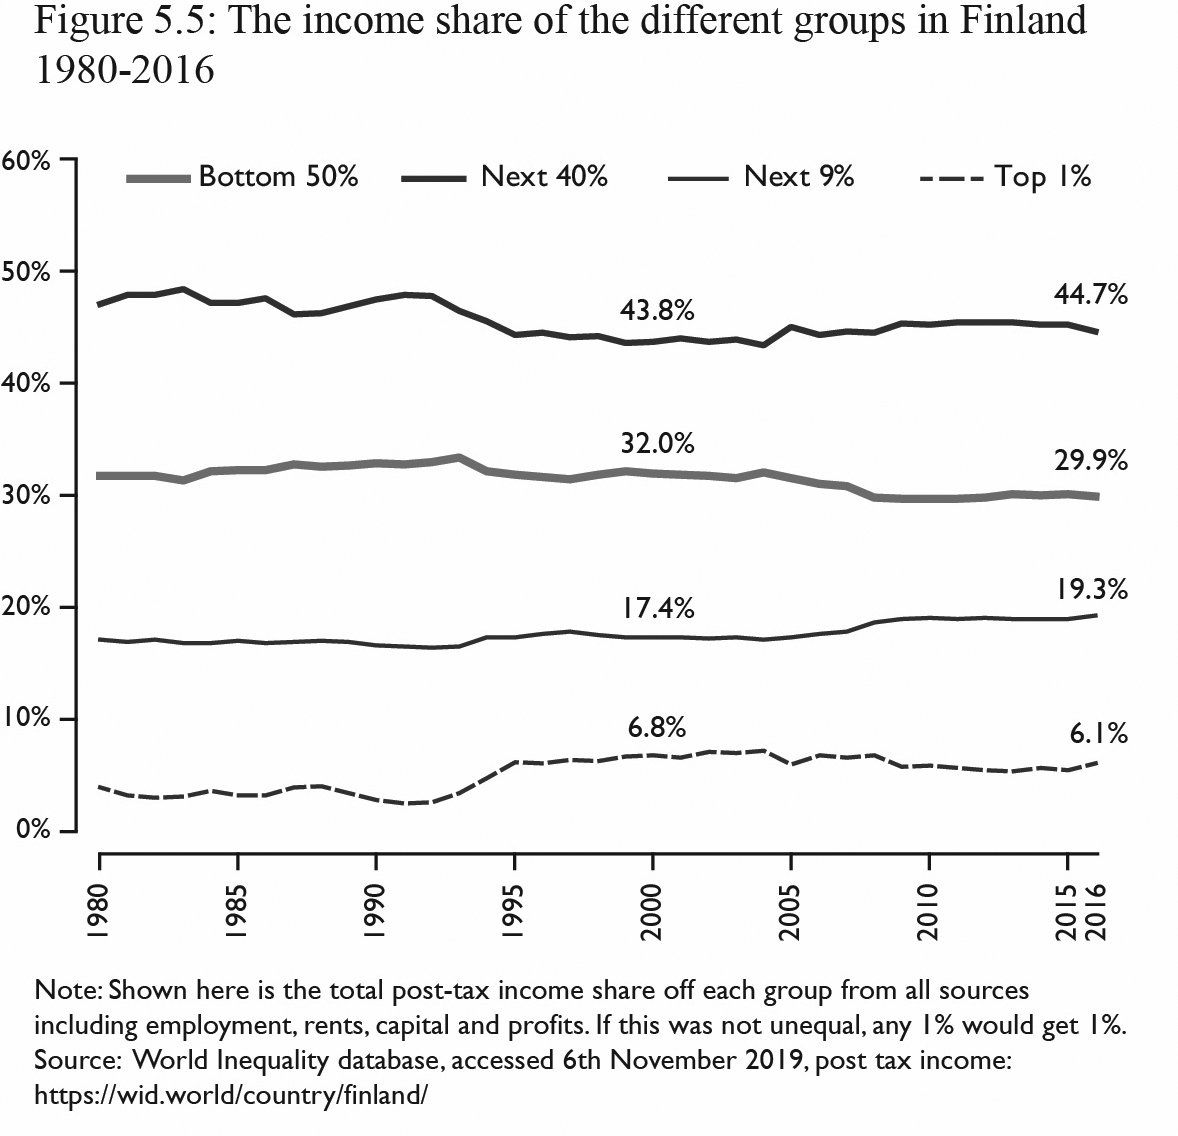
Figure 5.5: Note: Shown here is the total post-tax income share of each group from all sources including employment, rents, capital and profits. If this was not unequal, any 1% would get 1%. Source: World Inequality database, accessed 6th November 2019, post tax income, https://wid.world/country/finland/