Finntopia Figures & Tables
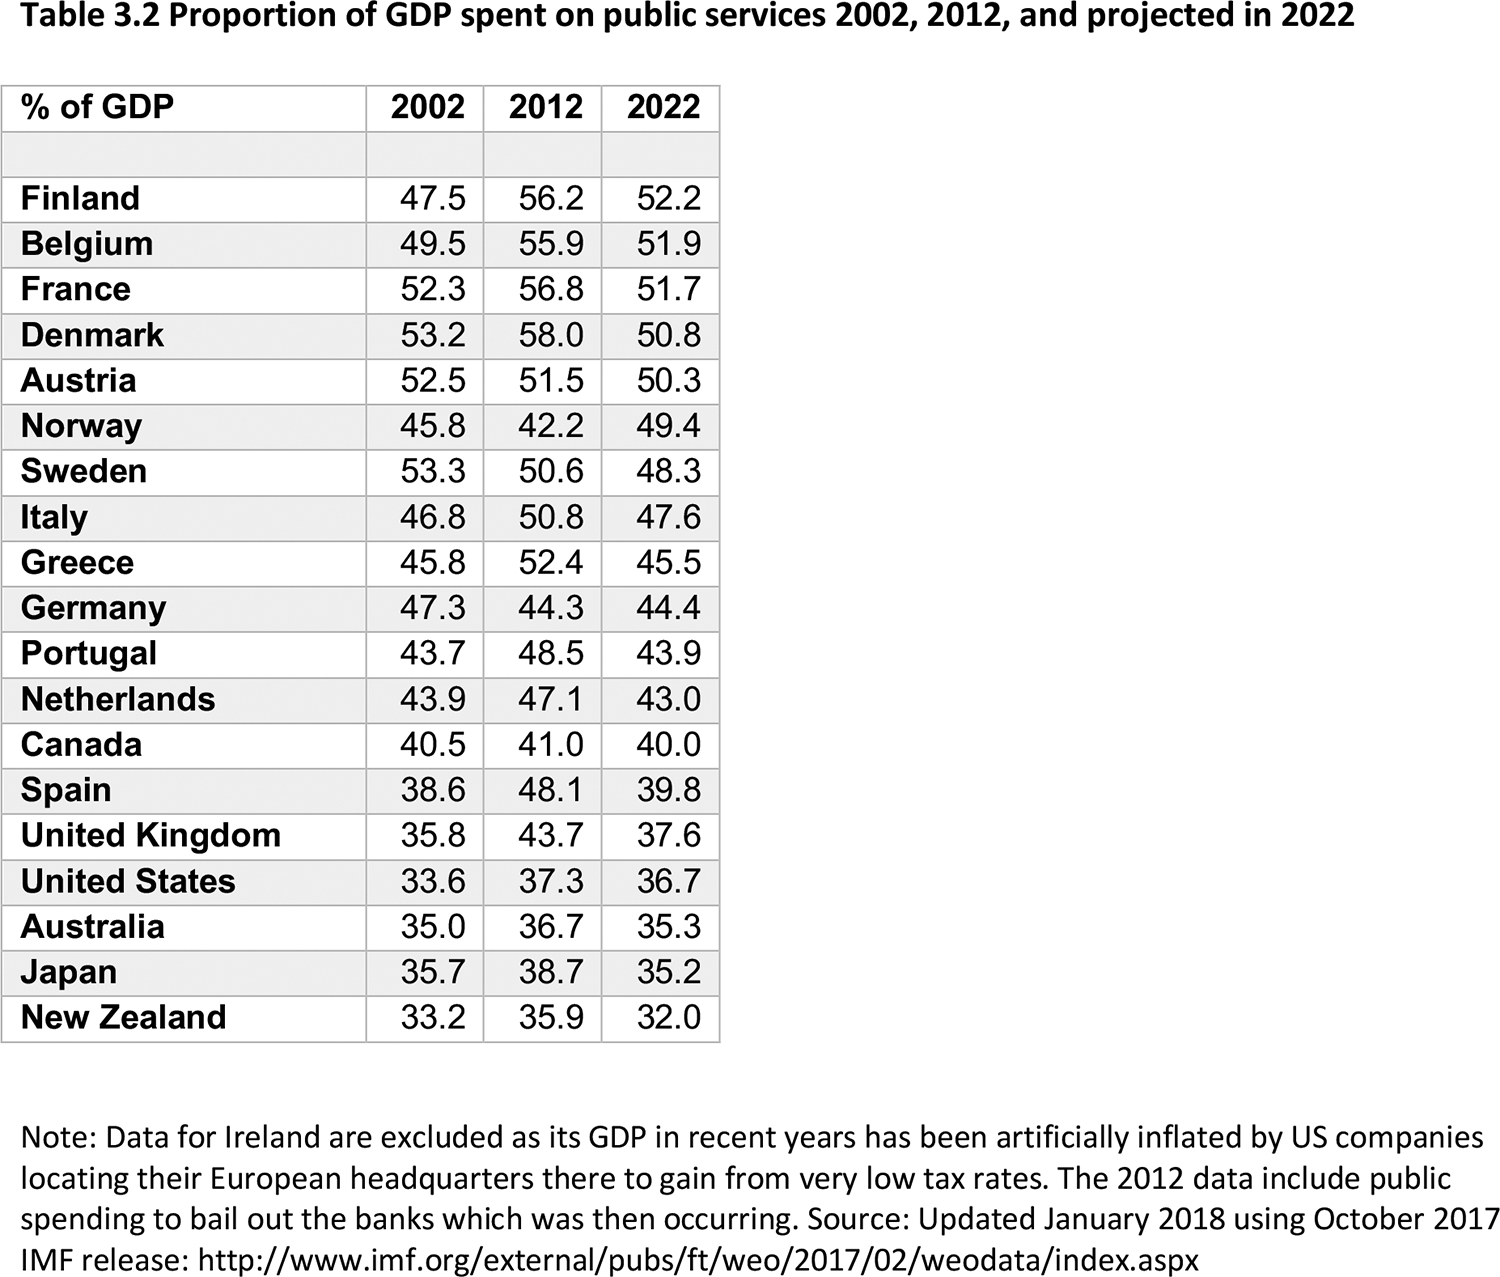
Table 3.2: Note: Data for Ireland are excluded as its GDP in recent years has been artificially inflated by US companies locating their European headquarters there to gain from very low tax rates. The 2012 data include public spending to bail out the banks which was then occurring. Source: Updated January 2018 using October 2017 IMF release: http://www.imf.org/external/pubs/ft/weo/2017/02/weodata/index.aspx