Finntopia Figures & Tables
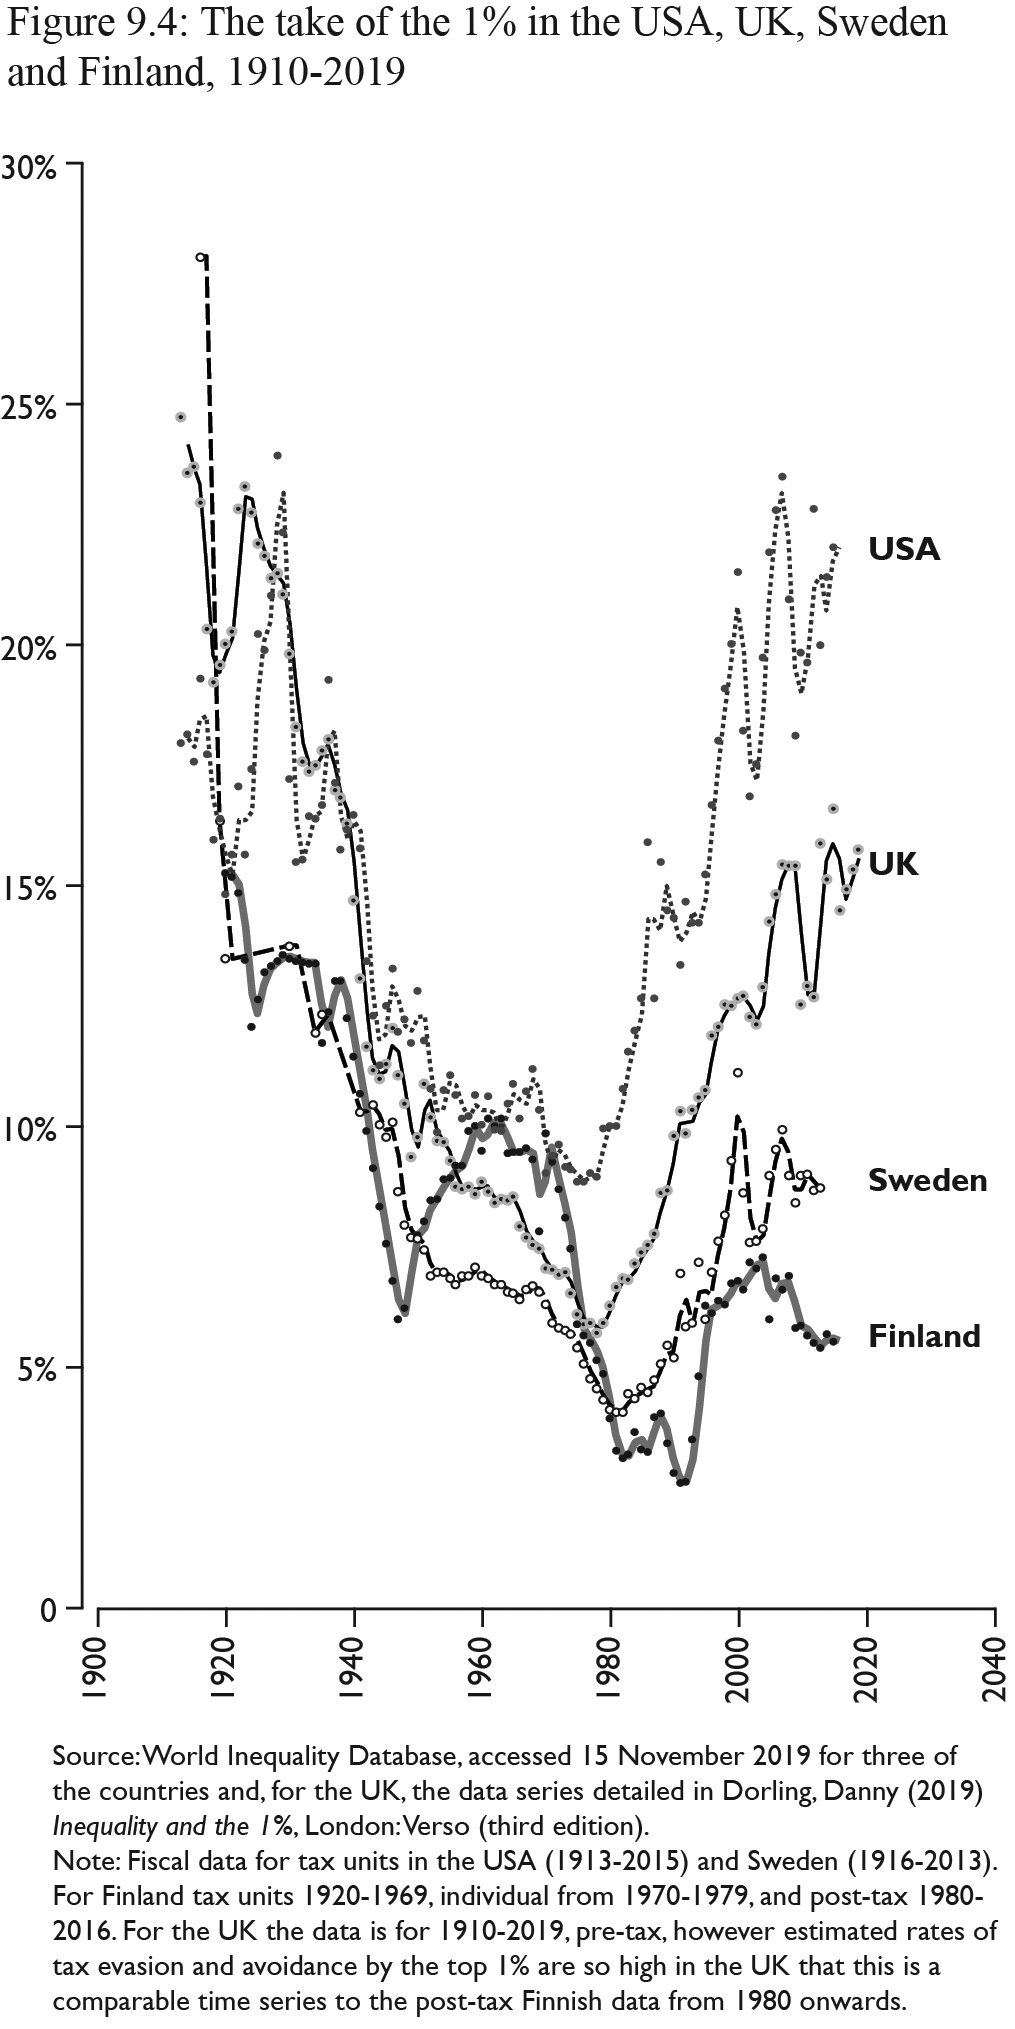
Figure 9.4: Source: Wold Inequality Database, accessed 15 November 2019 for three of the countries and, for the UK, the data series detailed in Dorling, Danny (2019) Inequality and the 1%, London: Verso (third edition). Note: fiscal data for tax units in the USA (1913-2015) and Sweden (1916-2013). For Finland tax units 1920-1969, individual from 1970-1979, and post-tax 1980- 2016. For the UK the data is for 1910-2019, pre-tax, however estimated rates of tax evasion and avoidance by the top 1% are so high in the UK that this is a comparable time series to the post-tax Finish data from 1980 onwards