Finntopia Figures & Tables
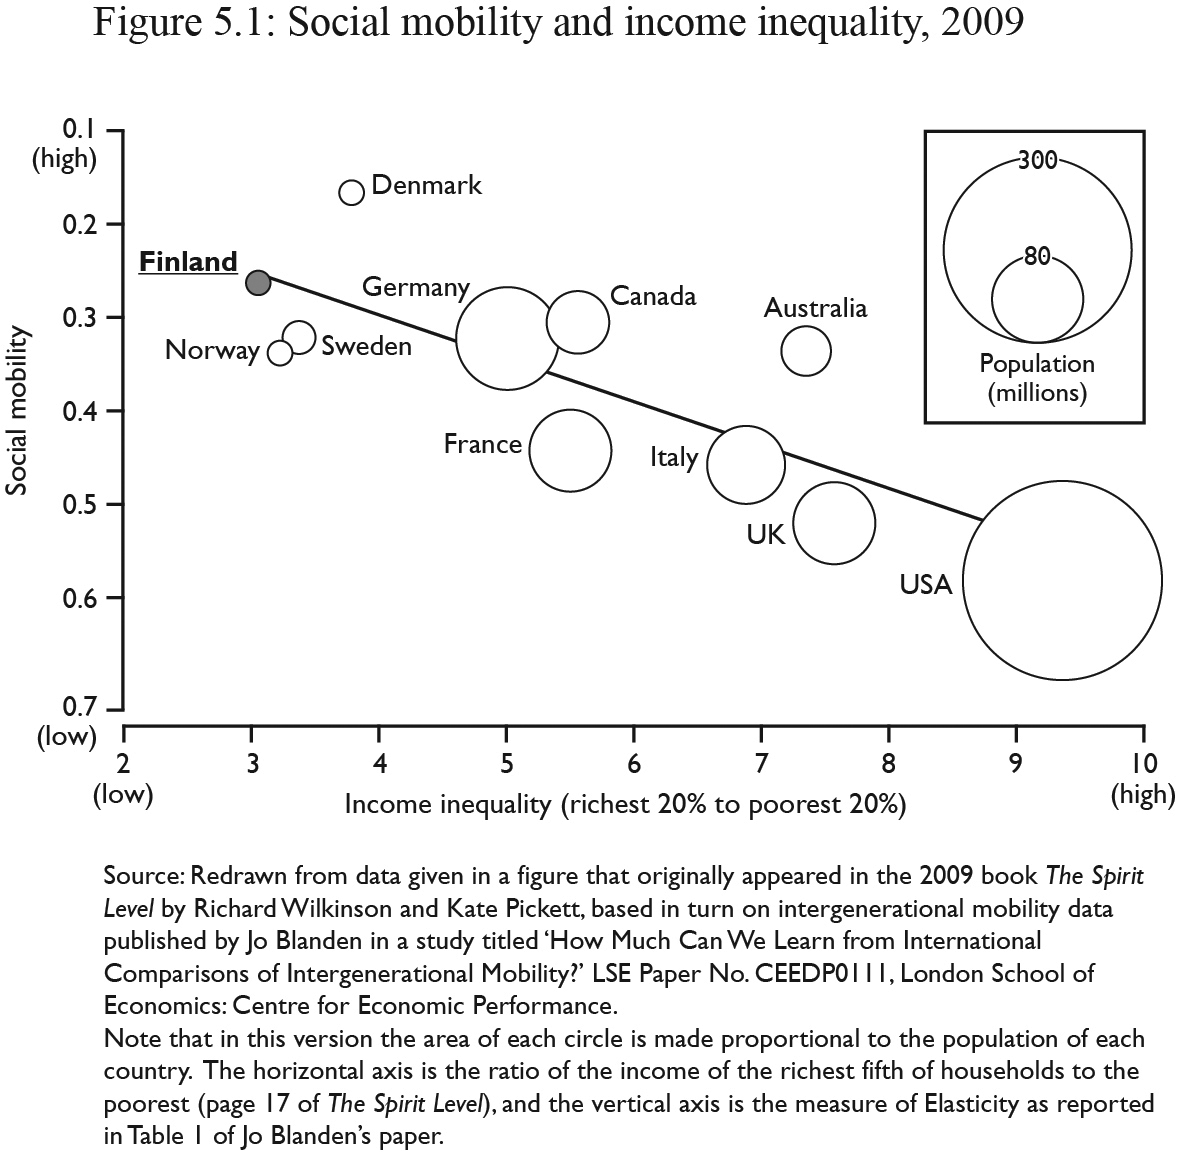
Figure 5.1: Source: Redrawn from data given in a figure that originally appeared in the 2009 book The Spirit Level by Richard Wilkinson and Kate Pickett, based in turn on intergenerational mobility data published by Jo Blanden in a study titled ‘How Much Can We Learn from International Comparisons of Intergenerational Mobility?’ LSE Paper No. CEEDP0111, London School of Economics: Centre for Economic Performance. Note that in this version the area of each circle is made proportional to the population of each country. The horizontal axis is the ratio of the income of the richest fifth of households to the poorest (page 17 of The Spirit Level), and the vertical axis is the measure of Elasticity as reported in Table 1 of Jo Blandon’s paper.