Finntopia Figures & Tables
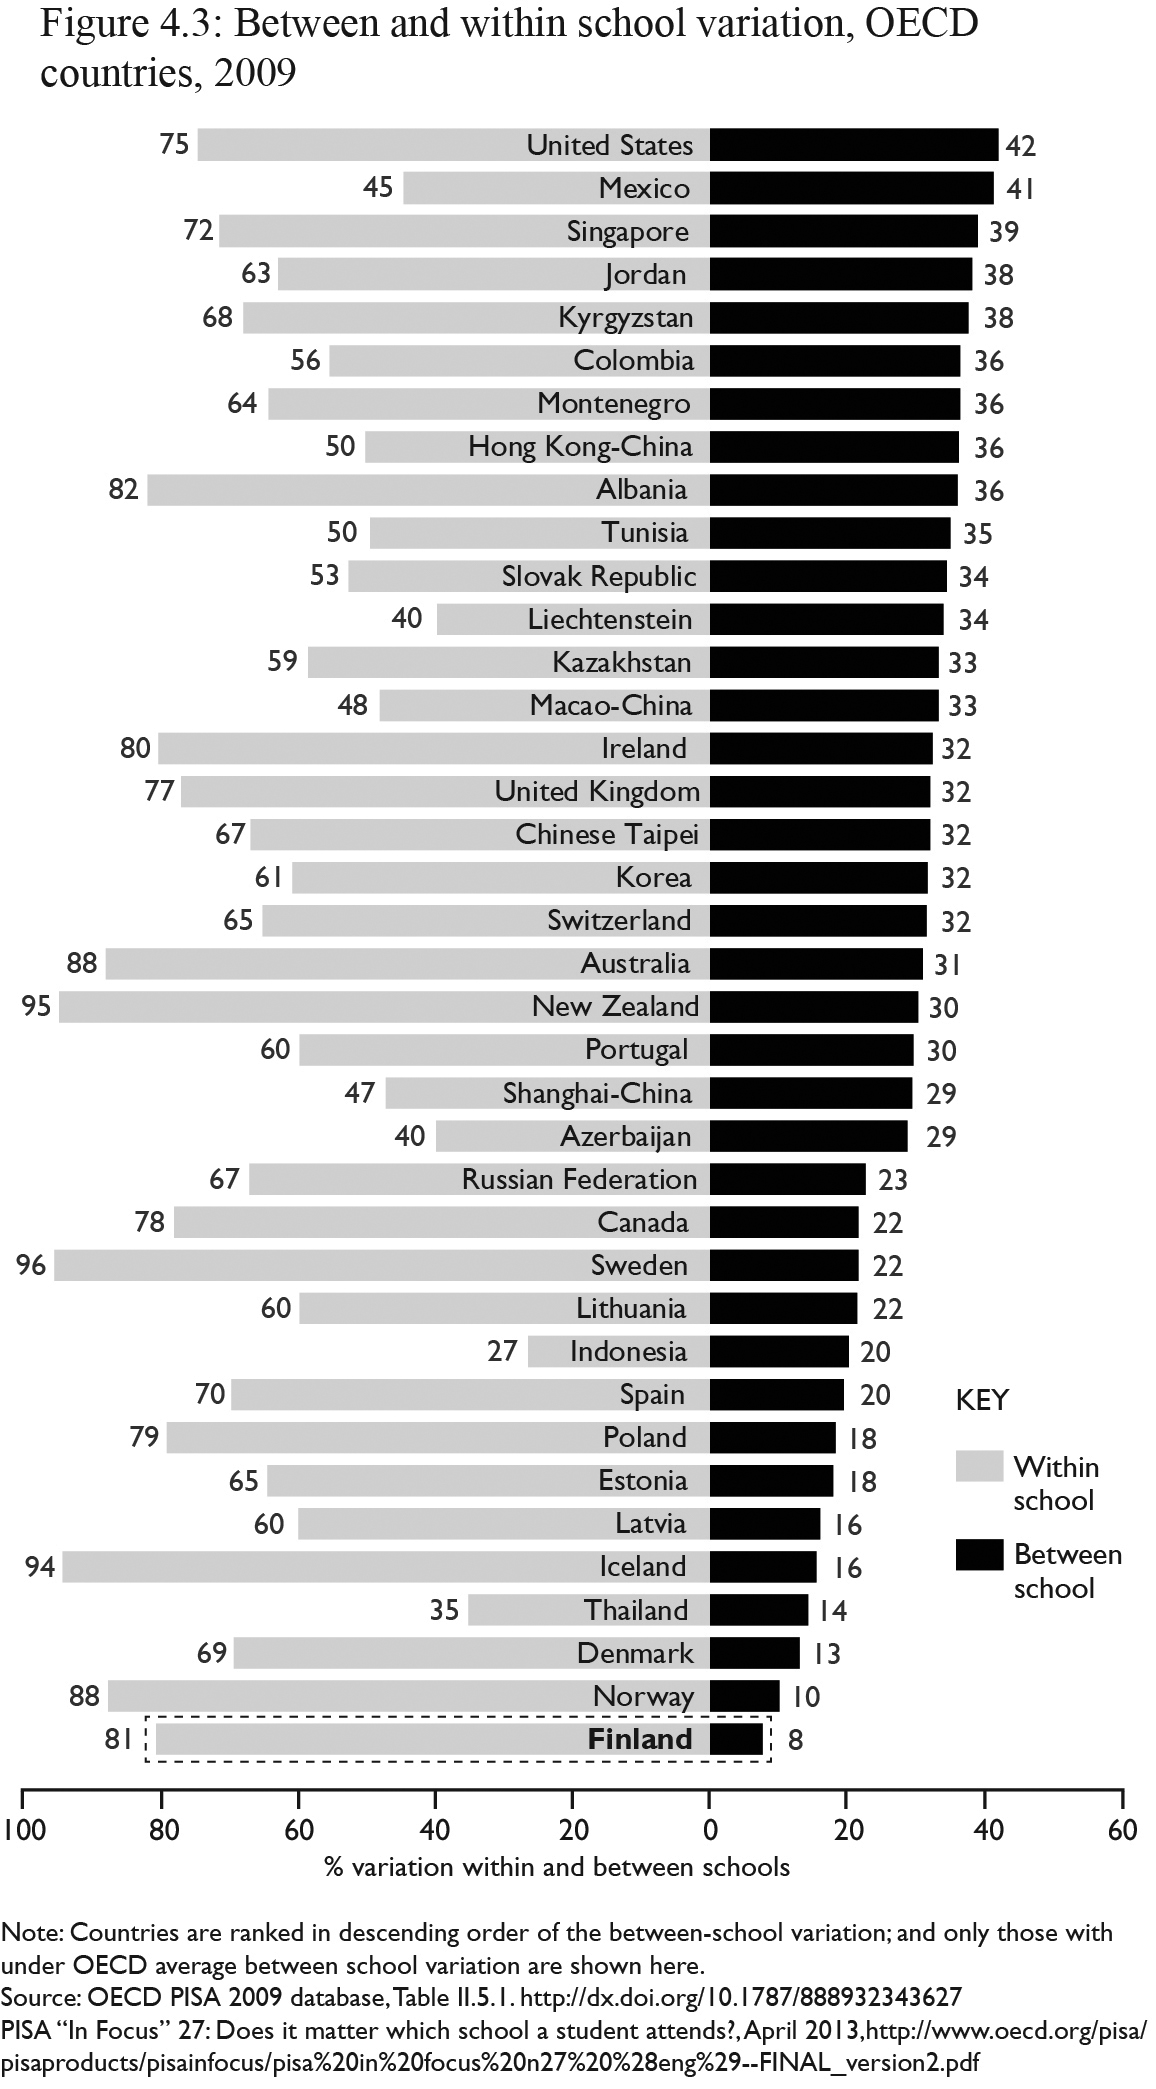
Figure 4.3: Note: Countries are ranked in descending order of the between-school variation; and only those with under OECD average between school variation are shown here. Source: OECD PISA 2009 database, Table II.5.1. http://dx.doi.org/10.1787/888932343627; PISA “In Focus” 27: Does it matter which school a student attends, April 2013, http://www.oecd.org/pisa/pisaproducts/pisainfocus/pisa%20in%20focus%20n27%20%28eng%29--FINAL_version2.pdf