Finntopia Figures & Tables
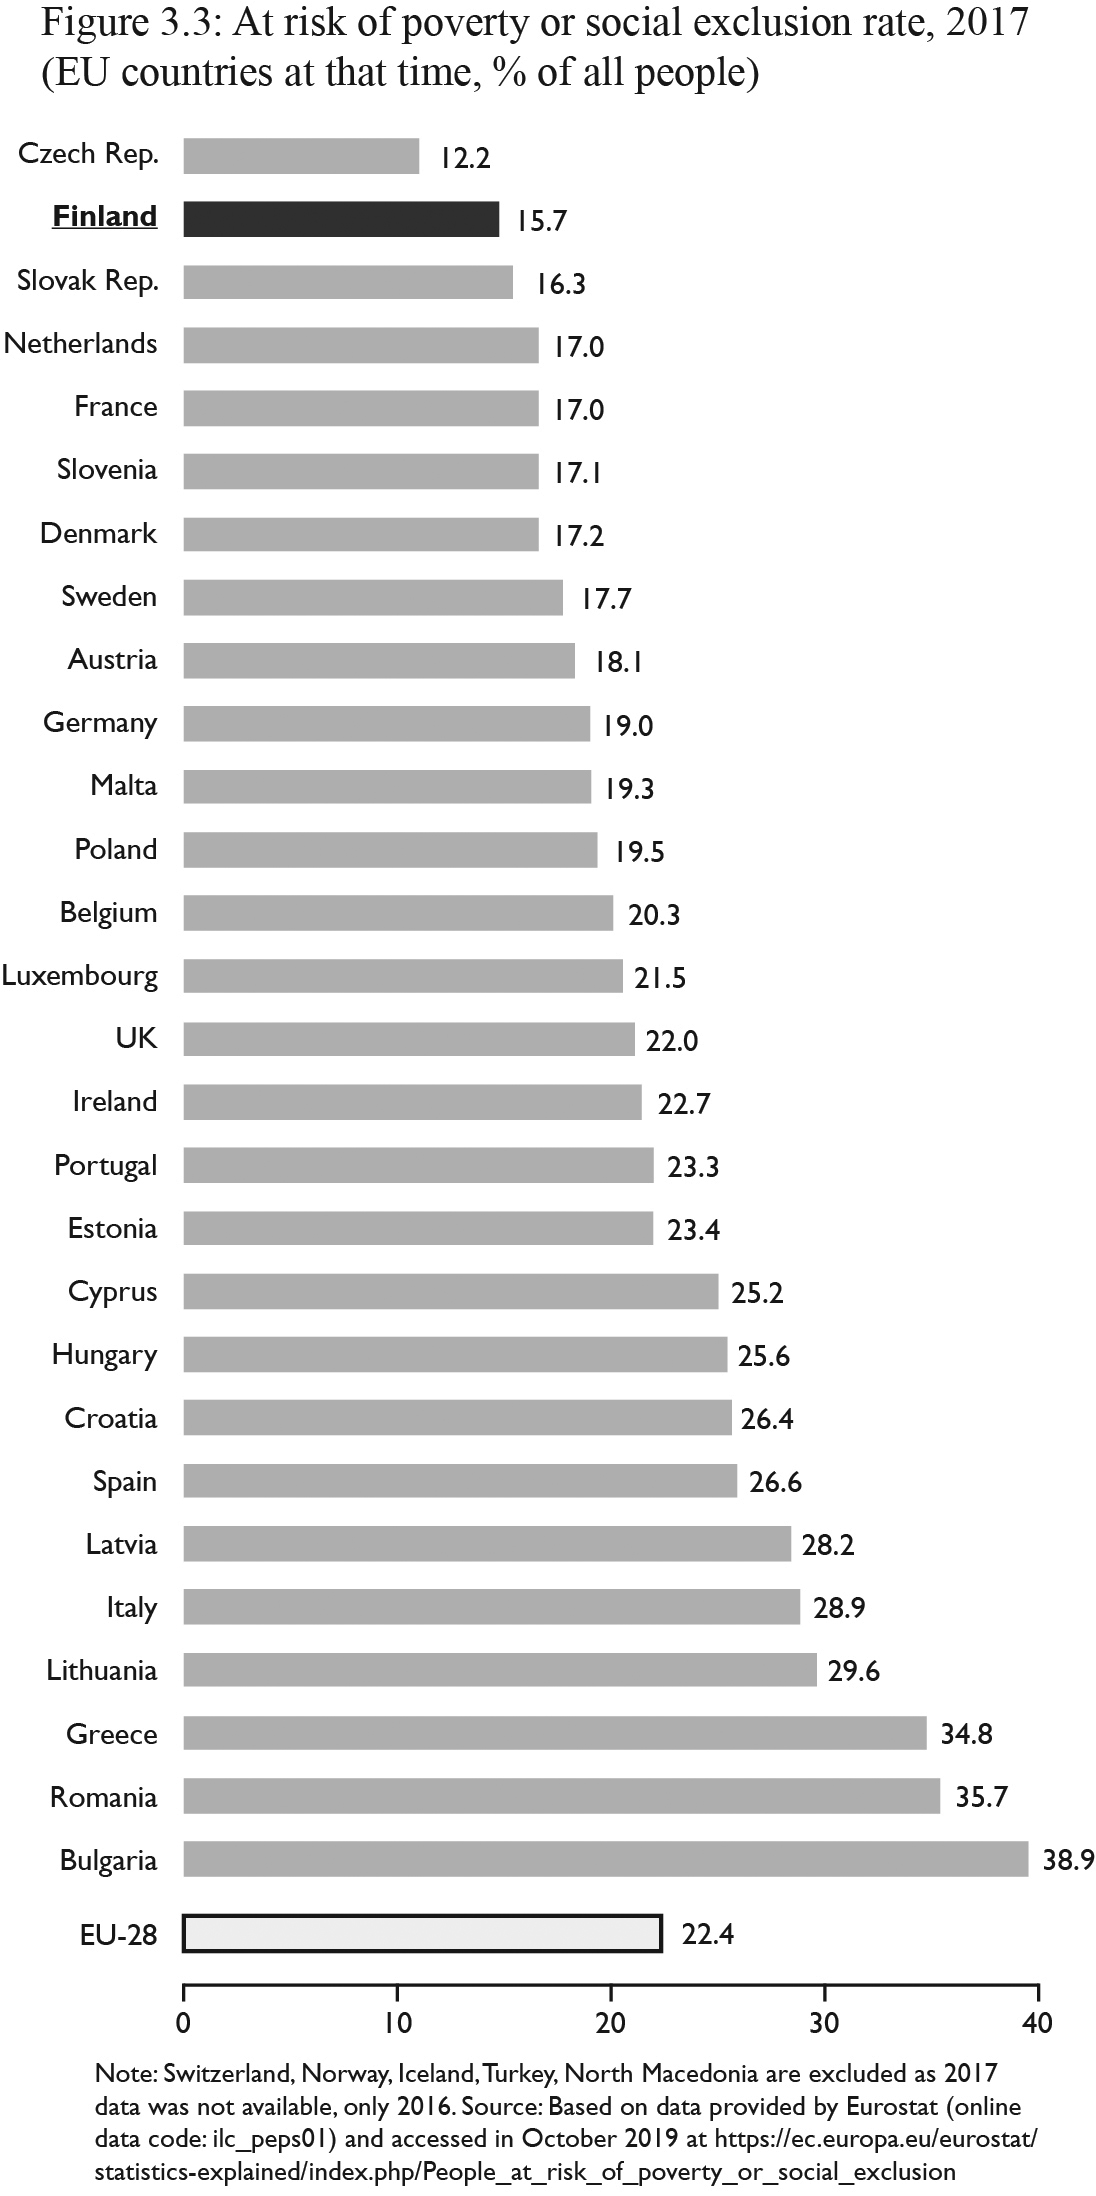
Figure 3.3: Note: Switzerland, Norway, Iceland, Turkey, North Macedonia are represented by 2016 data instead of 2017. Source: Based on data provided by Eurostat (2018d) (2018C0 (online data code: ilc_peps01) and accessed in October 2019 https://ec.europa.eu/eurostat/statistics-explained/index.php/People_at_risk_of_poverty_or_social_exclusion
