Finntopia Figures & Tables
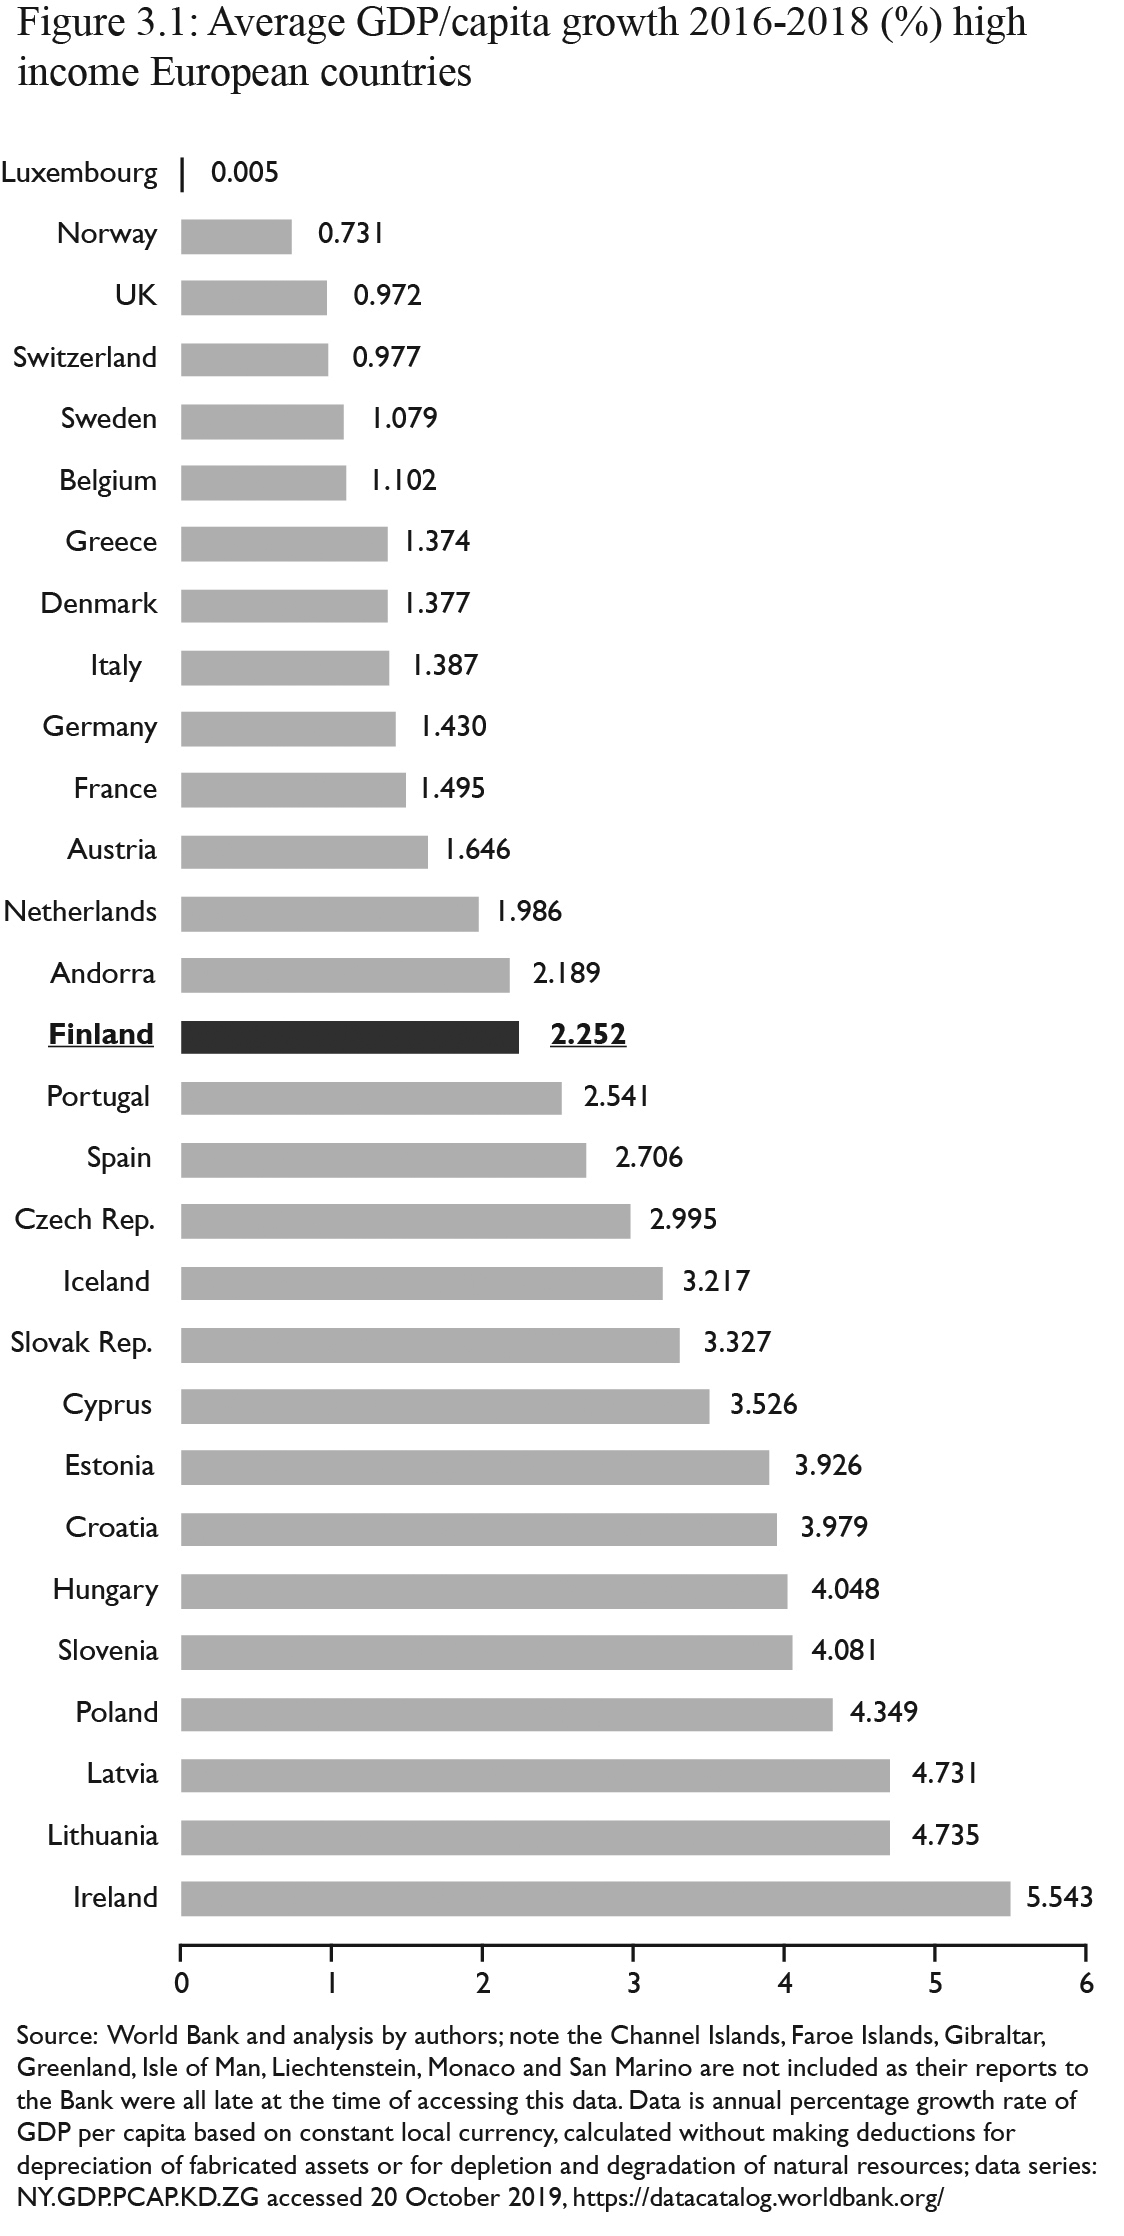
Figure 3.1: Source: World Bank and analysis by authors; note the Channel Islands, the Faroe Islands, Gibraltar, Greenland, the Isle of Man, Liechtenstein, Monaco and San Marino are not included as their reports to the World Bank were all late at the time of accessing this data. Data is annual percentage growth rate of GDP per capita based on constant local currency for high income countries (‘high’ as defined by the World Bank): calculated without making deductions for depreciation of fabricated assets or for depletion and degradation of natural resources, data series: NY.GDP.PCAP.KD.ZG accessed 20 October, https://datacatalog.worldbank.org/