Peak Injustice Figures and Tables
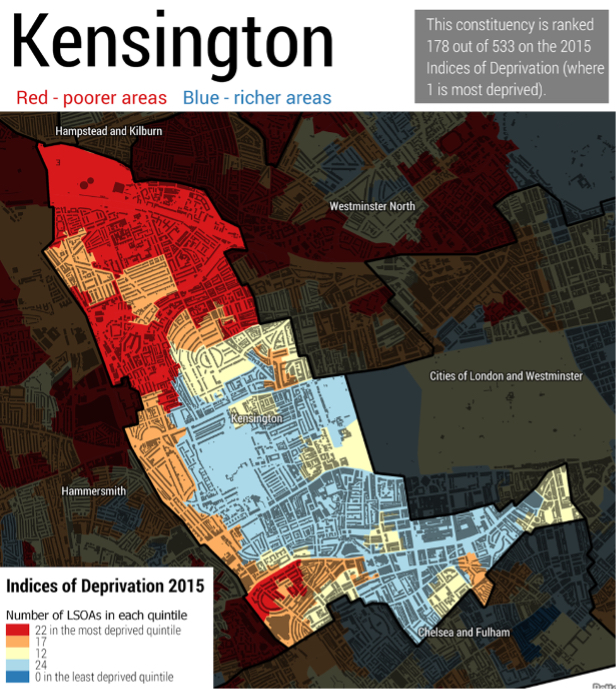
3.4 Neighbourhoods in Kensington coloured by their poverty rate, 2015
Overview | Previous | Next