Brexit – the Ides of March
The ides of March, March the 15th, is the date on which Romans traditionally settled debts. It was the date Julius Caesar was murdered. The phrase is associated with turning points in history.
Why, exactly two months before this date, did the UK prime minister fail to secure a deal acceptable to all but a small minority of MPs on the 15th of January 2019? Only 196 Conservative MPs voted to support her that day, the day when the first ‘meaningful vote’ was held. Only another half a dozen other members of parliament rallied to her cause, notably not including her supposed allies in the DUP. Some 432 MPs opposed the deal she presented. It was the worst defeat that any British government has ever suffered. January 15th 2019 dwarfed the terrible defeats of 1920s governments and was almost three times larger than the worse defeat any government suffered in the 1970s – the last two most contentious electoral decades, and the last two decades which were turning points in British economic and political history.
Why did the Prime Minster present a ‘deal’ that was so awful that even her own MPs, in such huge numbers, rejected it? One answer was that no better deal could be negotiated. The bargaining position of the UK, in its attempts to leave the EU, is so awful that Mrs May and all her hundreds of officials and all the many resigning and rebounding Brexit and Exit ministers were simply unable to come back with anything better. This was even after many protracted months of negotiations, begging and pleading, with the well-meaning negotiators of the rest of the EU 27. The 588 pages was it. The best that could be arranged if the UK really wanted to leave. That, at the end of the day, was all that could reasonably be put on the table. It happened like this because the vast majority of EU countries, especially the larger and more powerful countries, have so little to lose from the UK leaving in comparison to what the UK has to lose.
This you need to know if you are working in public service. If you are the head teacher of a school where you lose sleep because the school meals you provide are the most important thing for many of the children in your school, and they grow thinner during the ‘holidays’, then you are obviously worried about the cost of food rising. You will be worrying about your school catering staff who are EU but not UK citizens. This situation is particularly acute in poorer parts of London. But similar reasonable fears can be found everywhere. If you are running a hospital in the Midlands, you will be greatly concerned about how you can continue to supply the same number of routine operations after March 29th without all the staff you need. Furthermore, you will have been talking to the hospital pharmacist about medical supplies, you too are become increasingly understandably frightened. I have talked to so many public sector professionals who are scared in recent months that I have lost count of the examples of what may be about to go so badly wrong.
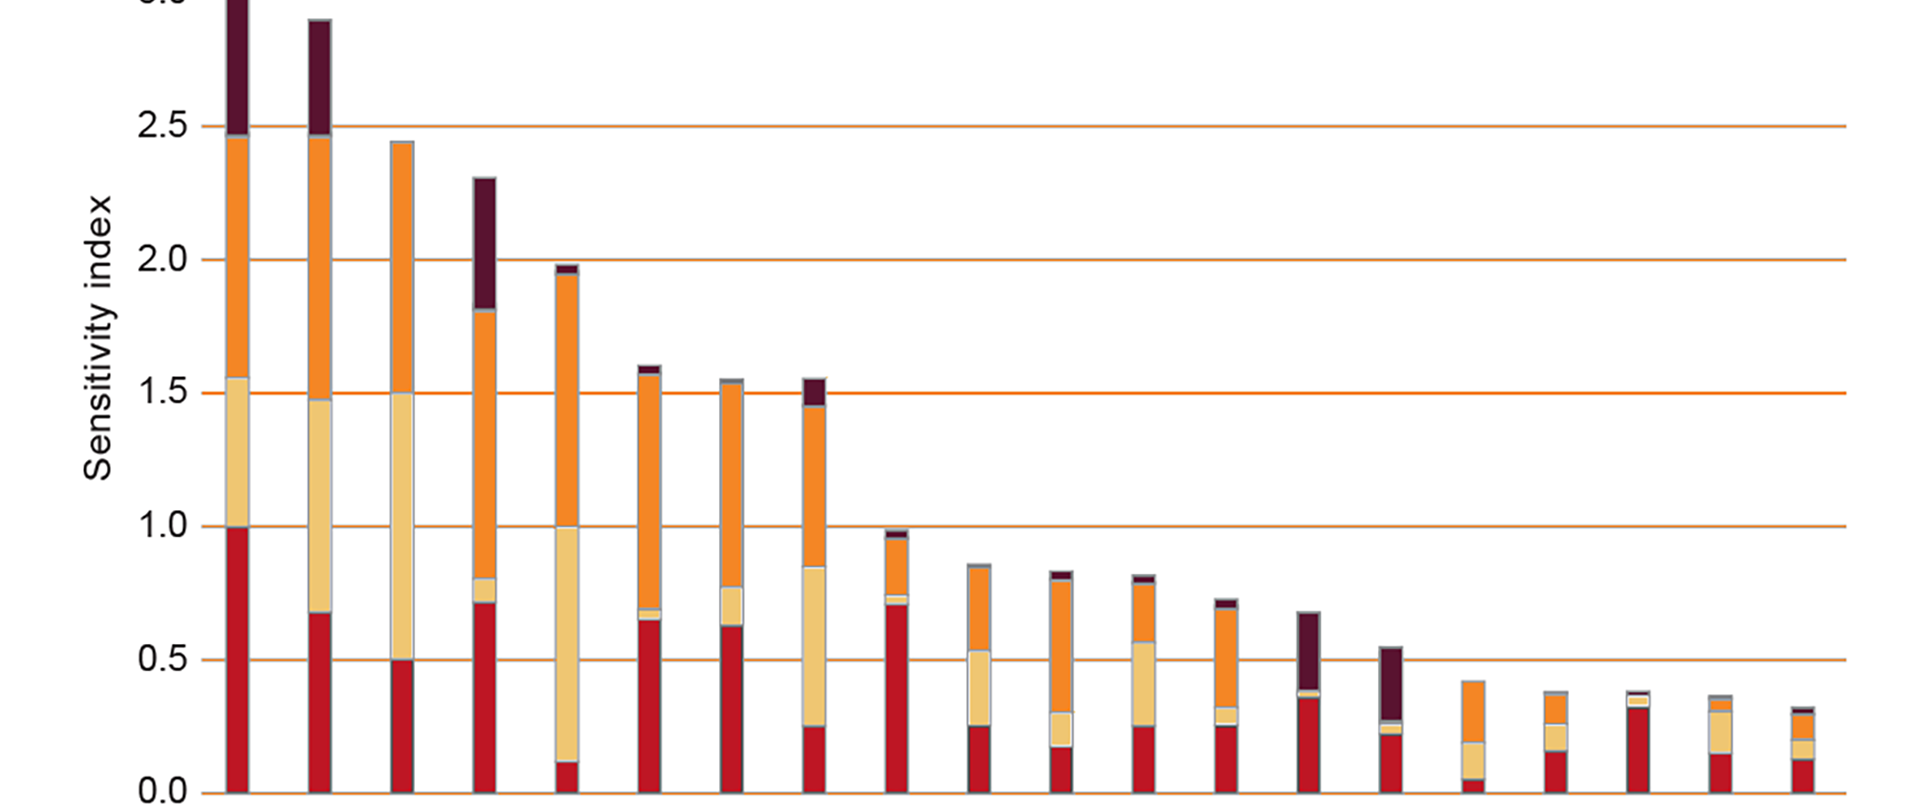
We desperately need to know why we are where we are. A few weeks before the Referendum was held in June 2016 a finance firm, Standard and Poor, produced a graph that still helps today to explain the situation (see Figure 1 below). That graph is reproduced below and shows their estimates of which other countries in Europe would be most adversely affected by the UK leaving the EU.
Figure 1: European countries most effected by Brexit other than the UK, estimates made in spring 2016:

European countries predicted to be most effected by Brexit other than the UK in spring 2016
From the Book by Danny Dorling and Sally Tomlinson: Rule Britannia, Brexit and the end of Empire, London: Biteback
Figure 1 shows that the one non-UK European country most effected by a hard exit would be Ireland. However, Ireland is also benefitting from being an obvious destination of choice for companies that wish to relocate from the UK to an EU member state where the common everyday language is English. Dublin is currently experiencing an economic renaissance. The second most effected country is Malta, which is very small. The third most effected country is Luxembourg, which is very small. The fourth most effected country is Cyprus, which is very small. The fifth most effected country is Switzerland, which is not a member of the EU and which is not involved in the negotiations. None of these most effected countries are especially greatly affected economically. Furthermore, there is (and can be) no border on the Ireland of Ireland. English politicians have been very slow to understand that. Although not also understanding who economically unimportant the UK has become, in terms of what it can supply to the rest of the EU that is vital, could be seen as similarly stupid.
The UK is utterly divided on Brexit. By a narrow majority the bulk of the votes to Leave were supplied by people who live in the South of England. At general elections most of those who voted to Leave normally voted Conservative or UKIP. Most Conservative voters voted Leave. Most Leave voters were (and still are) social class A, B or C1. You need to understand all this when you are trying to figure out why British politicians, and especially Conservative MPs, are acting in such perverse ways. In many ways they are simply reflecting the wishes of a very vocal group of their supporters; and so very rich Brexit funders.
Figure 2 (below) shows the geographical correlation of the Leave vote verses deprivation. The correlation was 0.03. In other words, there was no correlation with deprivation at all. Within some of the local authority areas shown in Figure 2, people in the poorer parts of the district will have been more likely to vote Leave. This is especially the case in London, Oxford and Cambridge. However, in just as many cases it will have been better-off people who more often voted Leave within at least as many other local authority districts. The Leave voters there were disproportionately older people who owned their homes outright. This was especially the case where the bulk of Leave voters were to be found, in the leafier parts of southern countries.
Figure 2: The proportion of those who voted voting leave verses the deprivation score of each area in England:

The proportion of those who voted voting leave verses the deprivation score of each area in England
From the Book by Danny Dorling and Sally Tomlinson: Rule Britannia, Brexit and the end of Empire, London: Biteback
Brexit reflected the rise of the far-right in the south of the UK over many decades. Towards the end of that process the southern concentrated Conservative party formally broke away from the mainstream Europeans Conservatives in 2009 and completed their exit from the European mainstream in 2014. In that year the speculation was that they would merge within the European Parliament with the ‘Belgian right-wing liberal Lijst Dedeker, the Danish People’s Party, Italian Lega Nord MEPs and a number of Latvian and Lithuanian MEPs currently part of the Union for a Europe of the Nations group.’ In the event they also initially ganged up with the neo-Nazi ‘Alternative for Germany’ party, until that group switched its European parliamentary allegiance to the UKIP grouping in 2016. The majority of British MEPs belong to European party groups that are to the right of mainstream European Conservatives. UK Conservative and UKIP MEPs are by far the largest group of far-right MEPS in Europe. You have to know this if you want to know how the UK is viewed from the mainland, and why all this is happening. In 2014 a majority (52%) of British people who voted in the European elections voted right-rate by European standards.
To be clear: UK Conservatives are the largest contributors of MEPs within the far-right ‘European Conservatives and Reformists’ group in the European parliament. UKIP are the now largest group within the “Europe of Freedom and Direct Democracy” extreme-right grouping in the European parliament. Here far-right means to the right of mainstream European Conservatives. Extreme right means to the right of the far-right. Europe’s far- and extreme-right will be in trouble without all these UK MEPs in the near future. That is not a concern for the EU negotiators.
Finally, when you are wondering what is happening over the course of the next few weeks and who brought this all about, consider the map shown in Figure 3. I have produced 28 such maps, one for every county in all of the South of England. In each and every case the electorate of the county in the South is lower than the electorate of a set of comparator areas (in this case the comparator is labelled ‘Anti-Dorset’). In each and every single case the Southern English county provided more Leave voters. In no case have I had to use the same area twice, and I have included every single area that voted in all of the UK in constructing these 28 comparisons. Figure 3 shows just one of the 28 maps. It shows that Dorset was more important than impoverished Torfaen in Wales, North and South Tyneside and the whole of Northumberland in getting the UK into the situation it finds itself today. If we don’t even understand this, we are going to find so much of what will happen next impossible to understand.
Figure 3: A comparison of voting in the referendum in Dorset as compared to areas outside of the south of England

A comparison of voting in the referendum in Dorset as compared to areas outside of the south of England
Part of a series of figures for each county of the South of England, in preparation, to appear here.
There are reasons behind the reason behind the reasons. On the day of the first meaningful vote, January 15th 2019, Sally Tomlinson and I published a book “Rule Britannia: from Brexit to the end of Empire” in which Figures 1 and 2 in this article were first presented and in which we trace the reasons back and back to eventually get to the legacy of the British Empire. You may well not agree with much of what we have written. A summary is here: http://www.dannydorling.org/books/rulebritannia/
But whatever your view is, you have no excuse not to know the basic facts about how weak the bargaining position of the UK was, who most voted out, and where most of them lived. No one who is numerate should blame the north, or the poor, or the working class for what is about to become us. On valentine’s day, February 14th 2019, Mrs May suffered yet another humiliating House of Commons defeat a by 303 to 258 votes. A fifth of her party did not support her, six Conservatives voted with Labour. Beware the Ides of March.
For a pdf of this article and the on-line version in Public Sector Focus click here.